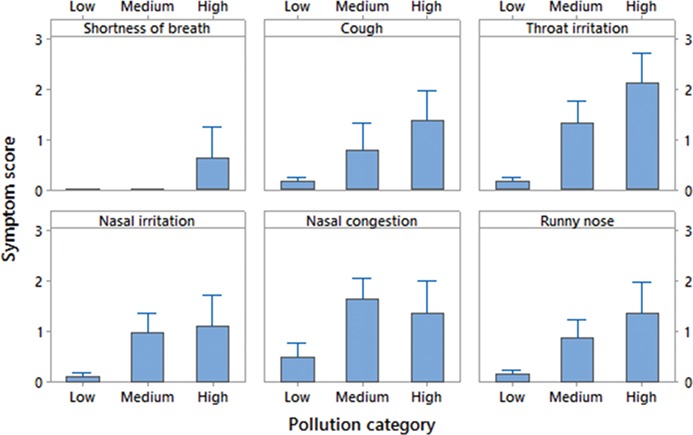
Figure 4.

Respiratory symptom and their average (of total) scores abroad, by pollution category (low, medium and high). Africa is not shown in the graph because only one participant travelled to the region, and calculation of overall symptoms with n = 1 introduces a bias when comparing.
