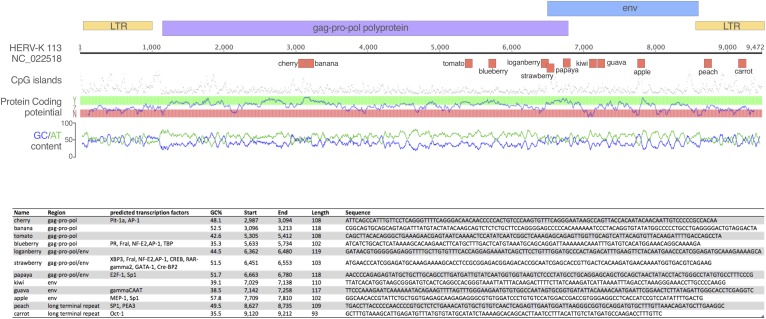
FIGURE 1.
Oligonucleotides tested in the study. The schematic depicts the oligos tested in the study mapped onto the HERV-K113 genome. Above the ruler, the colored boxes represent the retroviral ORFs and LTR regions; below are the oligos, which are named for ease of reference. Corresponding statistics for each oligo are presented in the table, including the sequence of each oligo.

