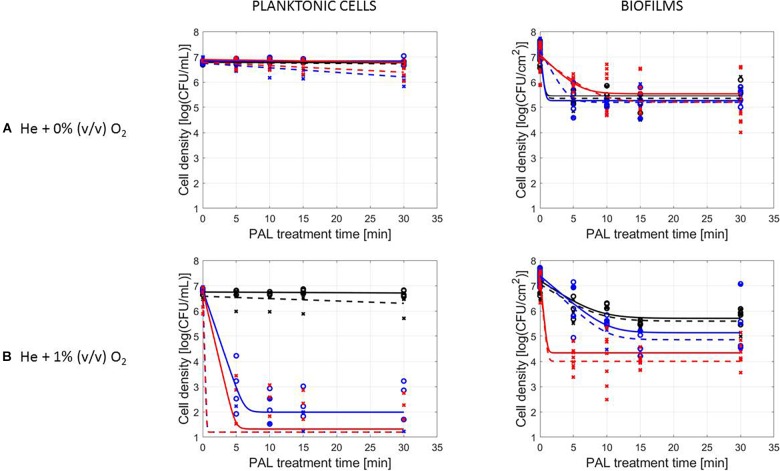
FIGURE 2.
Survival curves of L. monocytogenes planktonic cells and biofilms after plasma activated liquid treatment. Plasma activated liquids were created using two different cold atmospheric plasma gas compositions (A) He + 0% (v/v) O2 or (B) He + 1% (v/v) O2, and three different generation times (10, 20, and 30 min). Experimental data (symbols) and global fit (line) of Geeraerd et al. (2000) model: total viable population (o, solid line) and uninjured viable population (x, dashed line).

