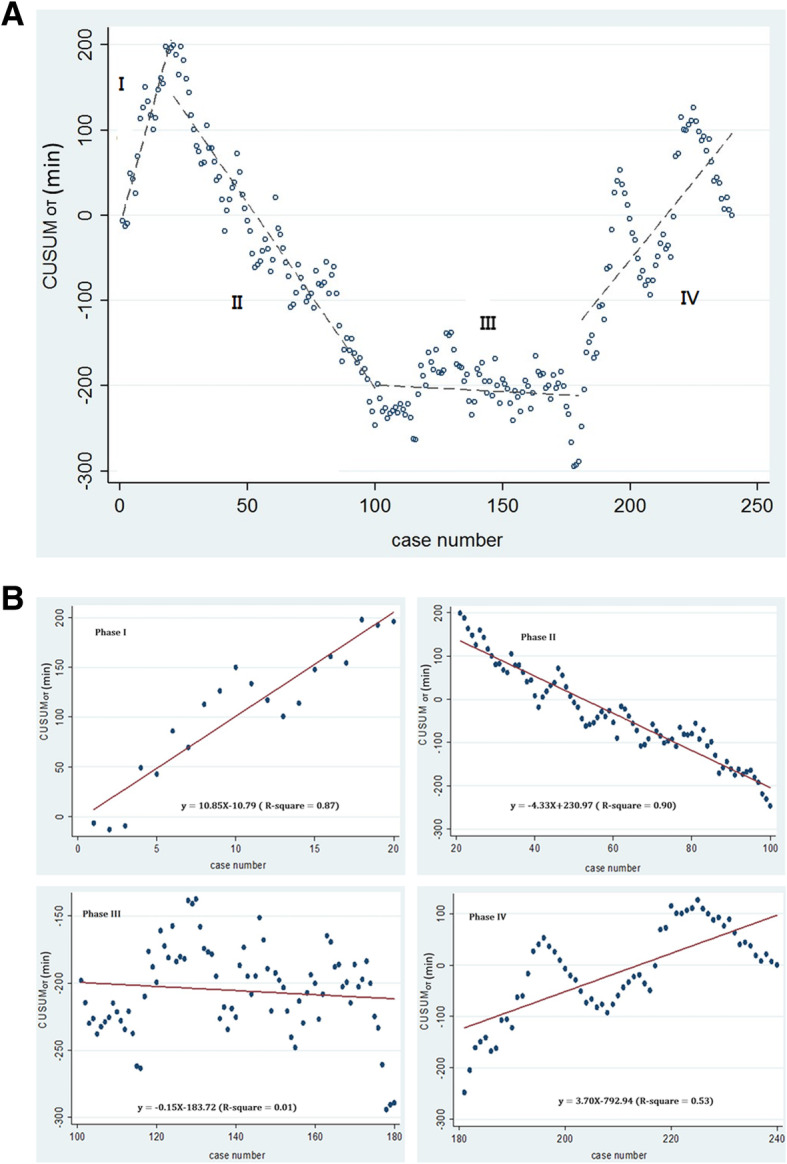
Fig. 2.

a The four phases of operative time in terms of the cumulative sum learning curve. b Lines of best fit for each phase. Phase I shows the initial learning phase. Phase II shows acquisition of competence phase after the initial 20 cases. Phase III shows the proficiency and plateau phase after 181 cases. Phase IV shows the post-learning phase
