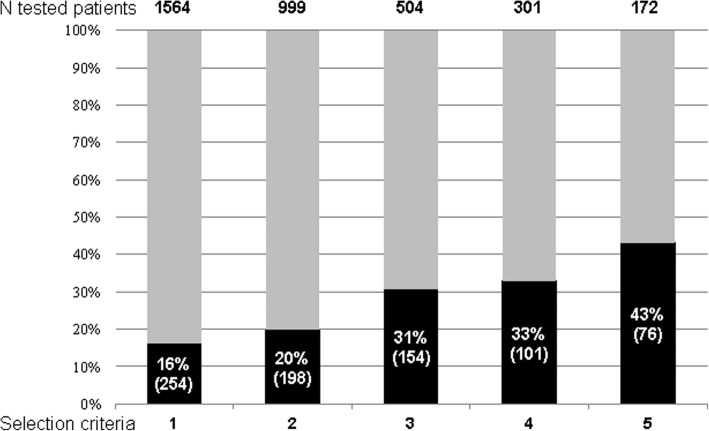
Fig. 2.
Proportions of identified monogenic cases with class 4–5 variants according to selection criteria. Actual numbers of tested patients (indicated at the top of the figure) and proportions of patients with identified monogenic diabetes (black bars, with actual numbers into parentheses) according to selection criteria. (1) Selection criteria as described in the “Methods” section; (2) patients with all 3 selection criteria; (3) patients with the 3 selection criteria plus a EuroCaucasian origin; (4) patients with a family history of diabetes in more than 2 generations, an age at diabetes diagnosis ≤ 40 years, and a body mass index < 25 kg/m2; and (5) same criteria as in 4 plus a EuroCaucasian origin. In total, 254 cases, i.e., 16% of the studied population, were diagnosed with monogenic diabetes. When more stringent criteria were used, the number of tested patients dramatically decreased to 11% of the total population in group 5, and the diagnostic rate increased up to 43%, but the actual number of diagnosed cases decreased sharply, 70% of the cases being missed

