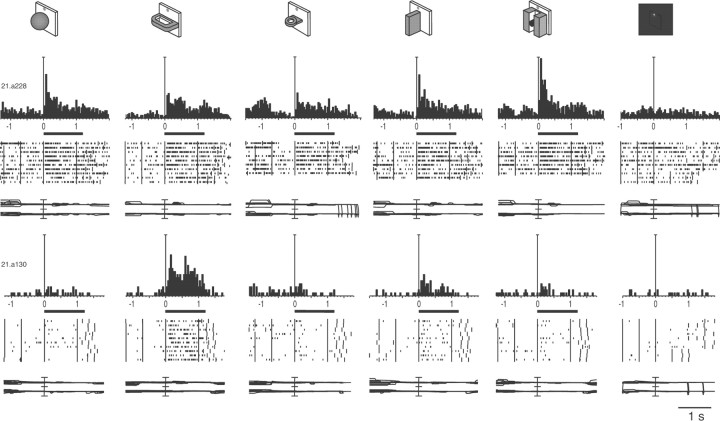
Figure 2.
Object selectivity in the Object viewing task. Top, objects tested (first five responses) and condition of LED fixation in darkness (rightmost condition). Bottom, two example V6A neurons selective for objects. Activity is shown as peristimulus time histograms (PSTHs) and raster displays of impulse activity. Below each display is a record of horizontal (upper trace) and vertical components (lower trace) of eye movements. Neural activity and eye traces are aligned (long vertical line) on the onset of the object illumination. Long vertical ticks in raster displays are behavioral markers, as indicated in Figure 1A. Both cells are selective for objects, the first preferring the vision of the stick-in-groove, the second of the handle. The tuning is sharper for the second, as it was not activated by 3 of the 5 objects. Black bars below PSTH indicate time of object illumination. Vertical scale bars on histograms: top, 160 spikes/s; bottom, 50 spikes/s. Eye traces: 60°/division.

