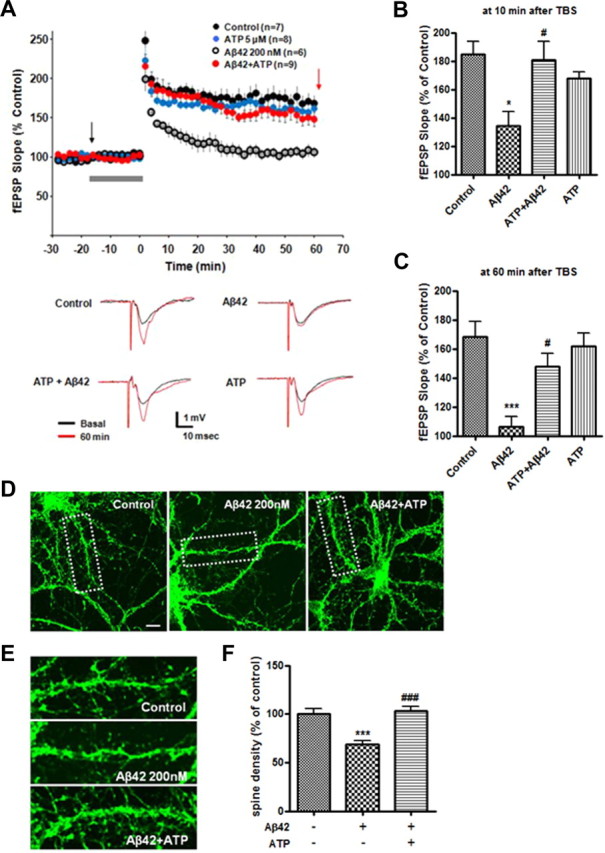
Figure 3.

Effects of ATP on Aβ42-mediated alteration of LTP in hippocampal slice. A, fEPSPs were recorded from the CA1 region of the hippocampus. Aβ42 (200 nm) inhibited TBS-induced LTP. In contrast, cotreatment of ATP (5 μm) with Aβ42 prevented the inhibition of LTP. Graph of individual fEPSP slope (top) evoked by stimulation throughout the different drug applications. Traces (below) represent averages of responses taken in different conditions at time points indicated by the black and red arrows of the fEPSP graph (top). B, C, Potentiation of fEPSP at 10 (B) or 60 (C) min after TBS. The gray bar indicates the aCSF (control) or chemicals (Aβ42, Aβ42+ATP, ATP) infusion for 20 min before TBS. p values were calculated using one-way ANOVA followed by a Tukey's multiple-comparison test. *p < 0.01 or ***p < 0.001 versus control group; #p < 0.05 versus Aβ42-treated group. D, Effects of Aβ42 on dendritic spine density at low concentration (200 nm). Primary rat hippocampal neurons (21 DIV) with or without ATP pretreatment (30 min) were exposed to Aβ42 for 48 h. Phalloidin Alexa-488 (green) was used to visualize dendritic spines. E, Magnified images of the areas marked with dotted lines in D. F, Quantification of spine density in dendritic segments. Statistical significance was analyzed by one-way ANOVA followed by a Tukey's multiple-comparison test. ***p < 0.001 versus vehicle (control) group; ###p < 0.001 versus Aβ42-treated group. Scale bar, 10 μm.
