Figure 4.
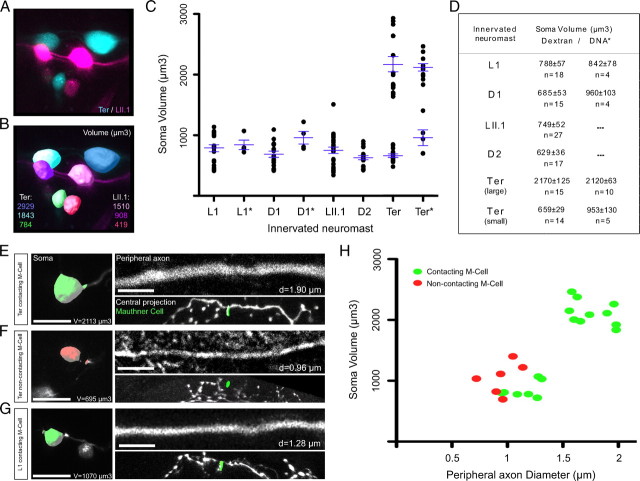
Neuronal subclassification based on soma volume and peripheral axon diameter. A, Posterior lateralis ganglion at 7 dpf with somata from afferent neurons projecting from the terminal neuromasts labeled with red-dextran (false-colored blue) and neurons projecting from the LII.1 neuromast labeled with magenta-dextran (magenta). B, Surface reconstruction of each soma that was used for volumetric analysis. C, Quantification of soma volume (μm3) at 7 dpf. Each dot represents the soma volume of an individual neuron. Data are grouped in the x-axis by both the innervated neuromast and the labeling method (no asterisk: dextran, asterisk: DNA). Averages and error bars (SEM) are shown in blue. Neurons projecting from the terminal neuromasts were split into two categories: large-soma (>1500 μm3) and small-soma (<1500 μm3) neurons. Averages and SEM were calculated separately for each category. D, Soma volume averages (μm3, with SEM) at 7 dpf, grouped by both the innervated neuromast and the labeling method. E–G, Three examples of lateralis afferent neurons at 7dpf, labeled by SILL1 DNA injection. Surface reconstructions for each soma are shown. Green and red indicates contacting and non-contacting the Mauthner cell, respectively. Peripheral axon images are focal planes. Snapshots of the three-dimensional reconstruction of the central projection and the distal tip of the Mauthner cell's lateral dendrite (green) are also shown. H, Correlation between contacts with the Mauthner cell, soma volume (μm3) and peripheral axon diameter (μm) as an average of ten equidistant points along the axon at 7 dpf. Each dot represents the soma volume and peripheral axon diameter of an individual neuron, labeled by SILL1 DNA injection. In all the panels dorsal is up and anterior is left. Scale bars represent 5 μm for panels showing peripheral axons, and 10 μm for panels showing neuronal somata.

