
Figure 5.
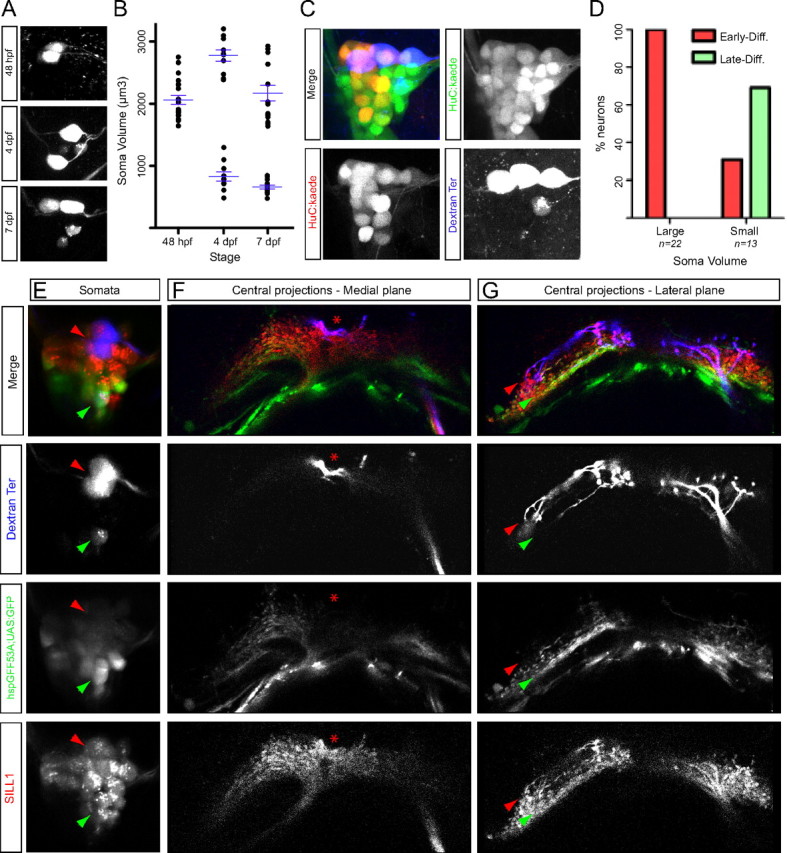
Simultaneous analysis of innervation/birthdate and soma volume of lateralis afferent neurons projecting from the terminal neuromasts. A, Posterior lateralis ganglion with somata from afferent neurons projecting from the terminal neuromasts labeled at different stages (48 hpf, 4 dpf, and 7 dpf). B, Quantification of soma volume (μm3) from afferent neurons projecting from the terminal neuromasts labeled at different stages. Each dot represents the soma volume of an individual neuron. The data were grouped in the x-axis by the stage of labeling. Averages and error bars (SEM), shown in blue, were calculated separately for the large- and small-soma neurons categories. C, Maximal projection of a posterior lateralis ganglion at 5 dpf resulting from a BAIT experiment. Kaede photoconversion was performed at ∼28 hpf. Early-born neurons (converted at ∼28 hpf) are green and red (yellow), whereas late-born neurons appear only green. Three large and one small soma from afferent neurons projecting from the terminal neuromasts were labeled by magenta-dextran uptake at 4 dpf. D, Percentage of large and small somata from afferent neurons projecting from the terminal neuromasts of both types: early- and late-born. E–G, Confocal planes of somata (E) and central projections (F, G) from lateralis afferent neurons projecting from the terminal neuromasts labeled by magenta-dextran at 6 dpf, in a Tg[SILL1; hspGFF53A; UAS:EGFP] triple transgenic. The red and green arrowheads indicate two large and one small soma, respectively. Central projections pictures: the asterisk indicates the indentation. Red and green arrowheads indicate dorsal and ventrolateral projections, respectively.