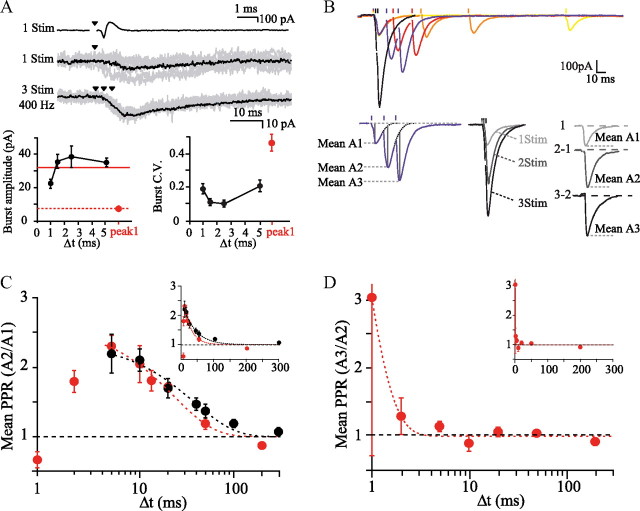
Figure 3.
High fidelity of synaptic transmission during high-frequency bursts. A, Increased reliability of GC–PC transmission during high-frequency bursts of stimuli. Top, Example of GC–PC paired recordings for one stimulus and three stimuli at 400 Hz. Solid dark line, Their averages. Bottom left, Amplitude of summated EPSCs against interstimulus interval. Bottom right, CV against interstimulus interval. Red, Mean A1. B, Extracellular triplet stimulation in the GC layer. Top, Examples of traces with intra-triplet frequencies ranging from 5 to 500 Hz. Bottom left, EPSC decays were fitted with a single exponential (dotted line), and the amplitudes of EPSCs were measured after correction for residual amplitude of the preceding EPSC. Bottom right, At frequencies >100 Hz, EPSC amplitudes were extracted from average responses to single, double, and triple stimuli. C, Red, Mean PPRA2/A1 as a function of interstimulus interval using extracellular stimulation (with a logarithmic x-axis). Black, Mean PPRA2/A1 in paired recordings (same as Fig. 1). Inset, Same data with a linear axis. D, Mean PPRA3/A2 as a function of interstimulus interval with a logarithmic x-axis. Inset, Same data with a linear axis.

