
Figure 4.
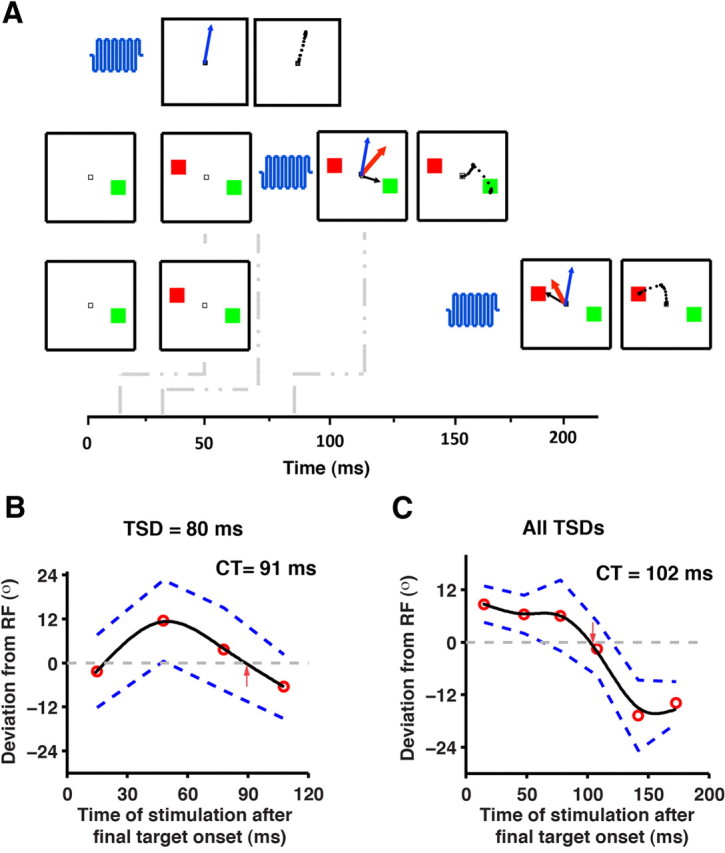
Evoked saccade deviation in step trials. A, In the top row of panels, when a stimulation pulse (blue oscillations) is delivered, a saccade (blue arrow) is evoked. The middle and bottom rows represent a short TSD (16 ms) trial that is microstimulated by either a short-latency (10 ms) or a long-latency (140 ms) pulse. The subsequent panel shows the evoked saccade, the saccade under preparation, and the averaged saccade as blue, black, and red arrows, respectively. Note that the black arrows are shown short of the target to represent saccades under preparation. The right-most panels show the observed saccade. The dots forming the saccade represent the eye position samples. At early stimulation times, the resultant averaged saccade is expected to be toward the initial target while at later stimulation times it is expected to be toward the final target. B, The evoked saccade deviation profile in a typical session for a particular TSD (80 ms) is shown. C, The averaged saccade deviation profile for the session from the three TSDs (16, 80, and 144 ms) is shown after aligning each of them to the onset of the final target. In B and C, the median of the deviation (red circles) is fit by a weighted-smoothing spline (solid black line). The dashed blue lines represent the 95% CI. Crossover time (CT) represents the time when the deviation profiles cross the RF toward the final target (denoted by the red arrow), as estimated from the fit.