
Figure 5.
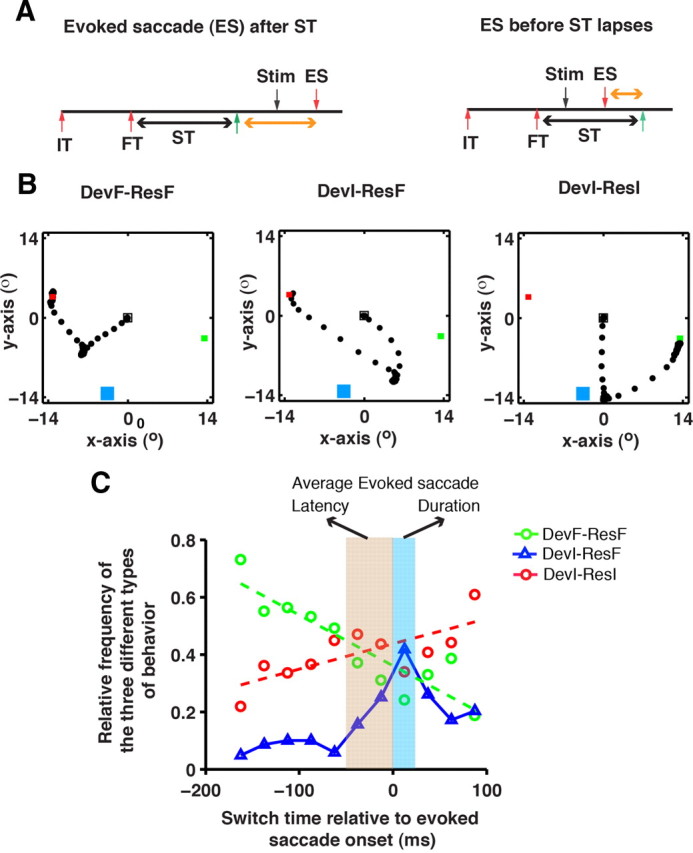
Behavioral relevance of the crossover time. A, Time line of a stimulated step trial showing the time of onset of the initial target (IT), final target (FT), time of stimulation (Stim), time of evoked saccade (ES) onset, and switch time (ST). B, The three types of behavior that occur depending on the evoked saccade onset with respect to the switch time (shown by the orange horizontal arrow in A). Left, A trial in which the evoked saccade deviated toward the final target and the subsequent voluntary saccade response was made to the final target (DevF-ResF). Middle, A trial in which the evoked saccade deviated toward the initial target and the subsequent voluntary saccade response was made to the final target (DevI-ResF). Right, A trial in which the evoked saccade deviated toward the initial target and the subsequent voluntary saccade response was made to the initial target (DevI-ResI). Green and red squares represent the initial and final target, respectively. The blue square represents the RF at the stimulation site. The sampled eye movement trajectory is shown as black-filled dots. C, Plot showing the relative frequency of the three types of behaviors as a function of the evoked saccade onset with respect to the switch time. In this plot, 0 represents the time of evoked saccade onset, trials to the left of 0 are those in which the switch time occurred before the saccade onset, and trials to the right of 0 are those in which the switch time is yet to occur. Trials are binned into 20 ms bins and the relative frequency was calculated for each time bin. The change in relative frequency of DevF-ResF and the DevI-ResI trials are fit by a linear fit (dashed green and red line). The width of the light brown box and that of the light blue box mark the average latency of the evoked saccade (48 ms) and the evoked saccade duration (25 ms) respectively.