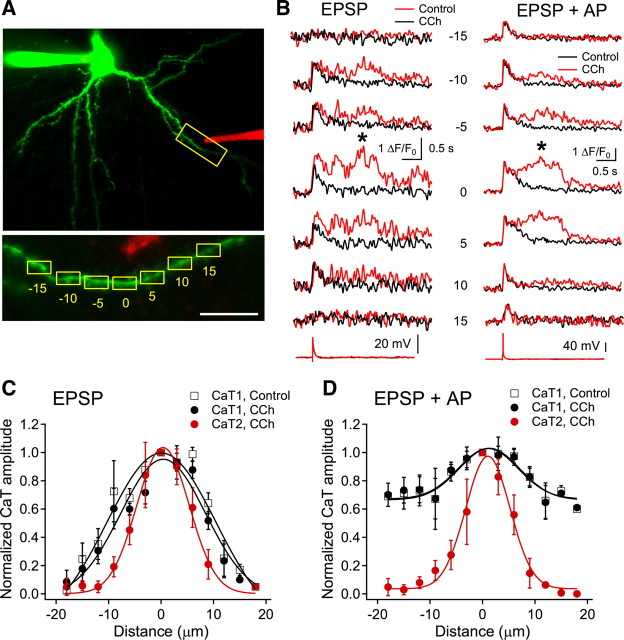
Figure 5.
Spatial profile of dendritic Ca2+ transients. A, Reconstructed image of a recorded cell and the location of the stimulus electrode (in red). Inset shows the analyzed dendritic regions. Numbers represent the distance in micrometers from the area showing maximal intensity. Scale bar, 10 μm. B, Representative fluorescence traces evoked by EPSP or pairing of EPSP and somatic AP (+10 ms). The asterisks indicate the peaks analyzed for CaT2. The numbers denote the dendritic areas shown in Figure 1A. C, D, Spatial profiles of CaT1 and CaT2 evoked by EPSP (C) and pairing of EPSP and somatic AP (D). The peak amplitude of each transient was normalized to the maximal amplitude in the respective datasets. Negative and positive values represent the distance toward and away from the soma, respectively, at the maximal fluorescence changes. A Gaussian fitting was applied to all the profiles. Data are a summary of response of five cells.

