Figure 6.
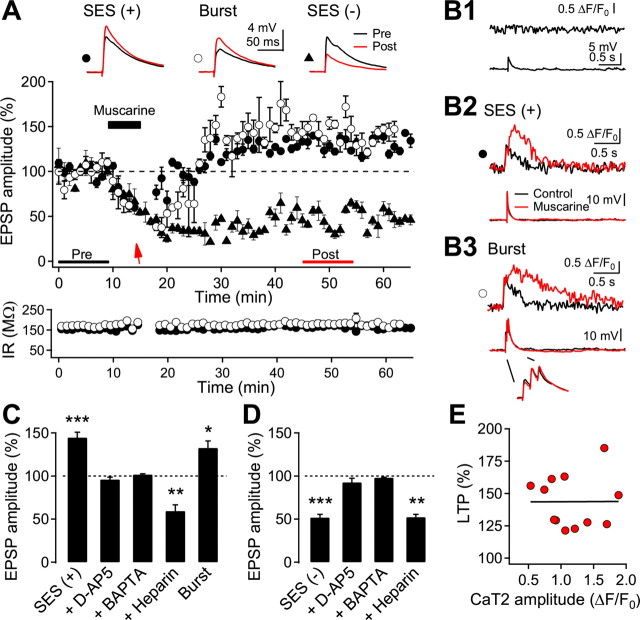
Induction of CaT2 and LTP with single-shock synaptic stimulation under muscarinic activation. A, Representative response of induction of LTP and LTD. The test EPSP was evoked by a glass electrode near basal dendrites as shown in Figure 5A. SES (arrow) was applied at the end of the application of 20 μm muscarine [SES (+), closed circle]. In some cells, only the baseline stimulation was continuously applied during the muscarine application [SES (−), closed triangle]. In another set of cells, a single burst of 3 APs (40 or 100 Hz) was applied instead of the SES (burst, open circle). Insets show the average EPSPs taken at the time indicated. Input resistance (IR) was monitored throughout the experiment, shown with the symbols corresponding to the upper panel for two cells. B1, B2, B3, The dendritic Ca2+ fluorescence and the corresponding voltage recordings evoked by test EPSP (B1), SES (B2), and a burst (B3). A control recording was taken before the EPSP recording. C, Summary plot for LTP induction by SES (n = 12) and in the presence of d-AP5 (n = 6). BAPTA (n = 4) or heparin (n = 5) was included in the pipette solution. LTP induced by the application of a burst (n = 3) instead of the SES is also shown. D, Summary plot for LTD induction. Continuous stimulation at the test intensity was applied during muscarinic stimulation without SES (n = 8) and in the presence of d-AP5 (n = 8), BAPTA (n = 4), or heparin (n = 3). E, Relationship between CaT2 amplitude and the magnitude of LTPm. A fitted line is also shown. *p < 0.05, **p < 0.01, and ***p < 0.001, compared with the baseline recording, respectively.

