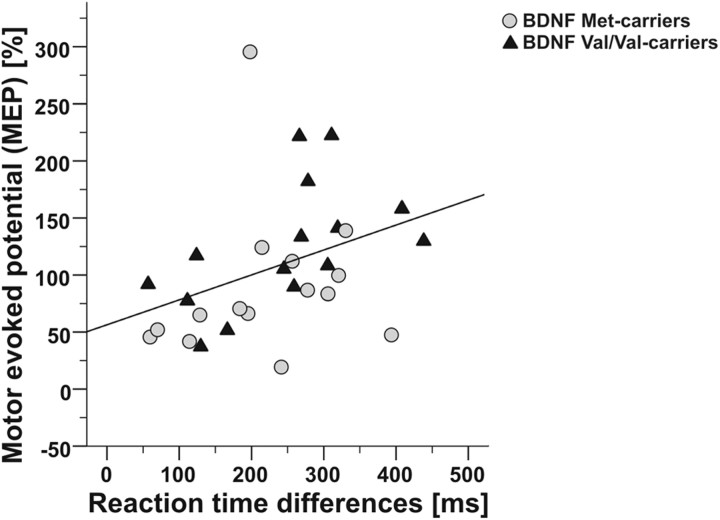
Figure 6.
Correlation of motor learning performance and PAS-induced cortical plasticity. Mean reaction time differences between sequential and random stimuli (reaction time differences, x-axis) correlated significantly with the relative motor evoked potential (MEP, y-axis) at post 0 following the PAS25 protocol (r = 0.52, p = 0.003). Gray circles, BDNF Met carriers; black triangles, BDNF Val/Val carriers.

