
Figure 3.
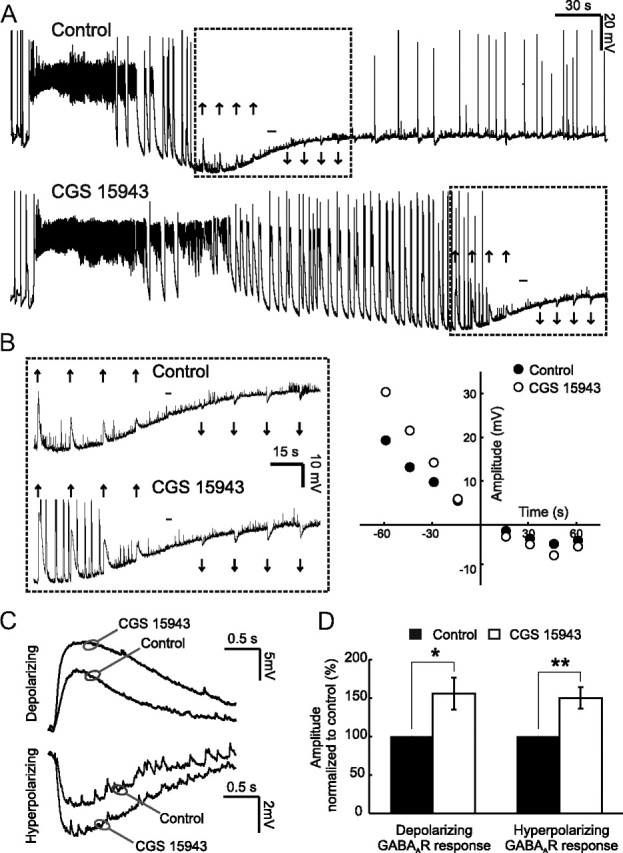
AR activity attenuates postsynaptic GABAergic potentials during seizures. A, Example seizures recorded under control conditions (upper trace) and in the presence of the AR antagonist CGS 15943 (1 μm) (lower trace). Upward arrows indicate depolarizing postsynaptic GABAAR responses, downward arrows indicate hyperpolarizing GABAAR responses, and the hyphen indicates the reversal point, when there is no net response to a muscimol puff. Rectangles indicate a 2 min time window, centered about the reversal for the GABAAR response. B, Traces (left) are expanded versions of the recording in A and illustrate the amplitude and direction of GABAAR responses. The plot (right) shows the amplitude of GABAAR responses in this recording (y-axis), in relation to the time when the GABAAR response switched back from depolarizing to hyperpolarizing (at 0 s on the x-axis); black circles represent GABAAR responses amplitude under control conditions, while open circles represent GABAAR responses amplitude under AR blockade. C, Averaged traces for the cell shown in A confirm that blocking ARs results in an attenuation of both the depolarizing and hyperpolarizing GABAAR responses. D, Population data (n = 10 cells) for the amplitude of depolarizing and hyperpolarizing postsynaptic GABAAR responses. Data are shown for the AR antagonist (open bars), normalized to control values (black bars). Error bars indicate SEM, *p < 0.05, **p < 0.01, paired t test.