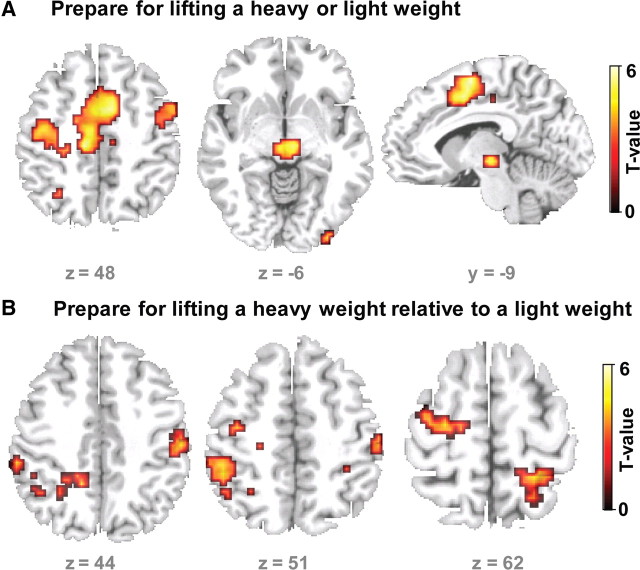
Figure 6.
Regional increases in BOLD signal during preparation (S1–S2 interval). A, Main effect of preparation regardless of the weight indicated by the S1 pre-cue. The sagittal, coronal, and axial slices show the regions that showed an increase in BOLD signal during the preparation of a lift (heavy and light). B, Relative increases in BOLD signal during the preparation for lifting a heavy weight relative to preparing for lifting a light weight. The statistical parametric maps are based on the fMRI data recorded after sham cTBS30% of left PMd.

