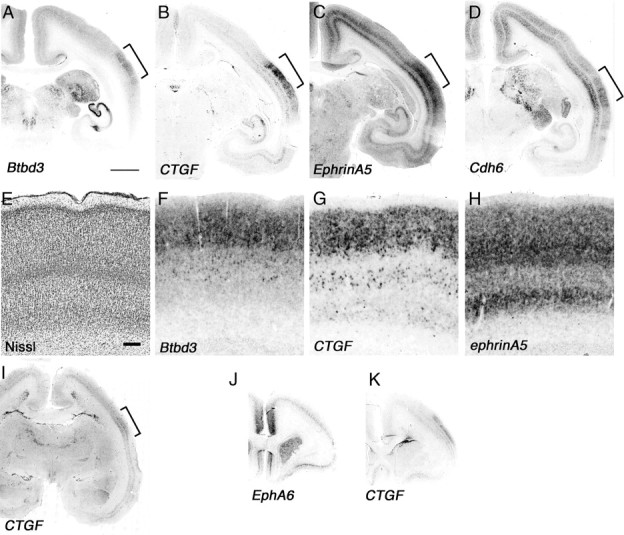
Figure 5.

MT is already developed in embryonic marmoset brain. Sections include the MT region (brackets) of the coronal section of neonate marmoset brain for ISH for Btbd3 (A), CTGF (B), ephrinA5 (C), and Cdh6 (D). E–H, Higher magnification of MT regions in A–C (brackets) and Nissl staining (E). Arrows indicate position of subplate (B, G). I–K, ISH of E90 marmoset brain at presumptive MT (I, bracket) and PFC regions (J, K). Scale bars: A (for A–D, I–K), 2 mm; E (for E–H), 200 μm.
