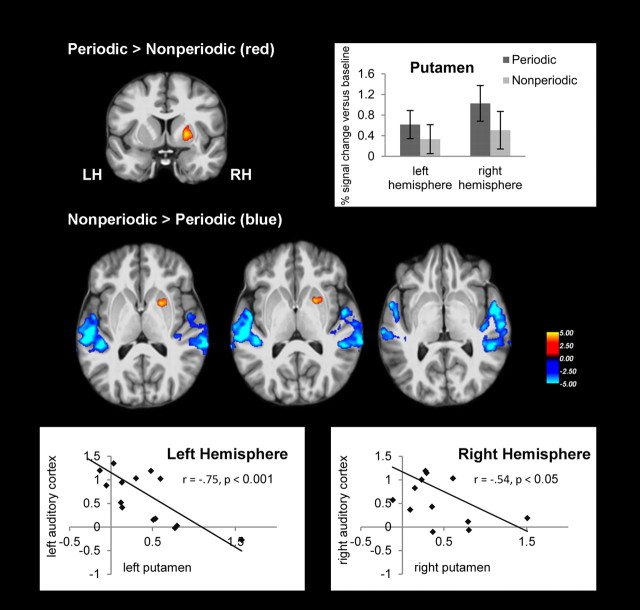
Figure 3.
Functional imaging results for the contrast periodic > nonperiodic (red) and nonperiodic > periodic (blue) stimulus sequences. Contrasts are thresholded at p < 0.001 and FDR-corrected on cluster level at p < 0.05. The color scale depicts t values. Images are depicted in neurological convention on the participants' average brain. The correlations between auditory cortex and basal ganglia activations are depicted separately for the left and right hemispheres in between-condition percentage signal changes. LH, left hemisphere; RH, right hemisphere.

