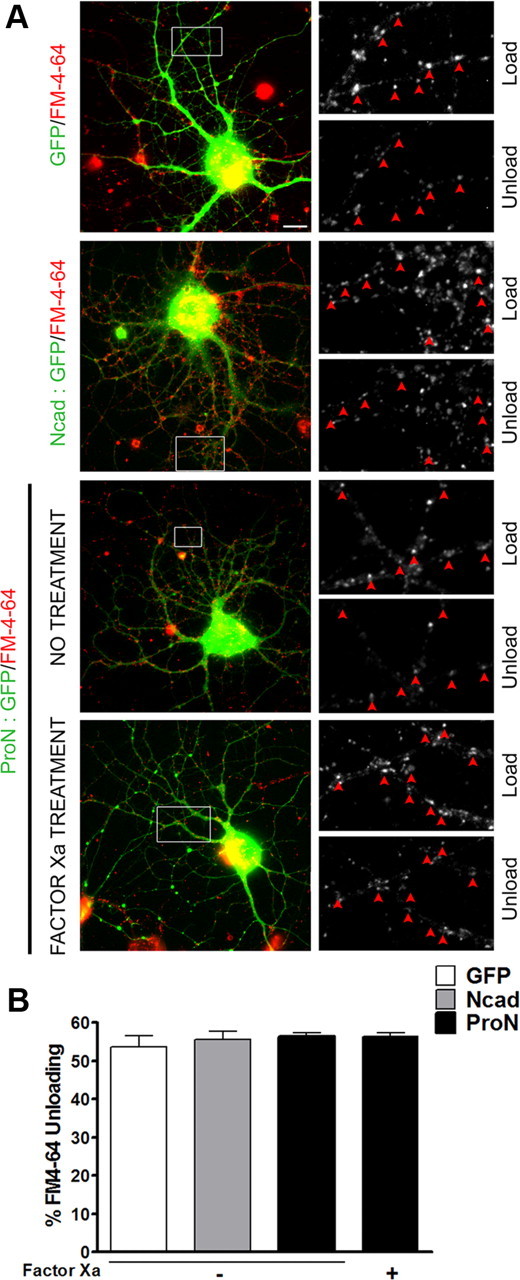
Figure 6.

FM4-64-labeled functional synapses. Primary hippocampal neurons were transfected, as above, with EGFP (as control vector), N-cad (N-cad/GFP; 4:1), or ProN (ProN/GFP; 4:1). A, Representative overlays (left panel) showing live transfected neurons (green) labeled with FM4-64 dye (red). Scale bar, 10 μm. The boxed areas are magnified on right and show loading and unloading of active terminals. The arrowheads point to puncta showing a drop in fluorescence intensity. B, The percentage of unloading in each group was similar. Quantifications from experiments (n = 3) on 6 (GFP), 13 (Ncad), 17 (ProN), and 13 (ProN factor Xa-treated) neurons show that the mean ± SEM from four groups are not significantly different from each other (one-way ANOVA). The percentage unloading from ≥75 puncta per neuron (∼600–1300 puncta per group) was calculated.
