
Figure 4.
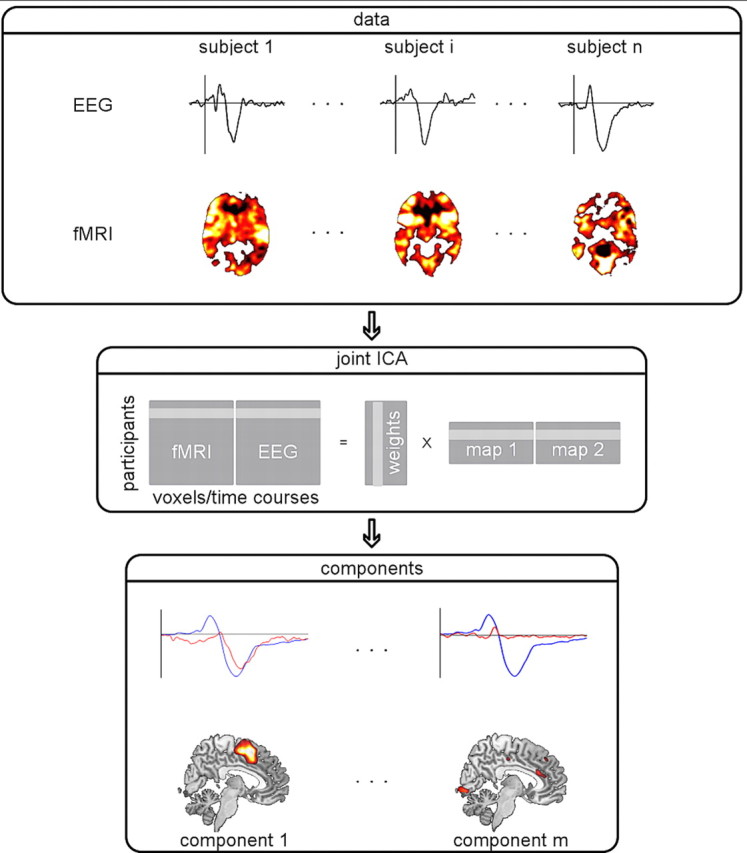
Schematic illustration of joint ICA. EEG and fMRI for a set of subjects are concatenated within the same matrix and subjected to a joint ICA. This procedure helps to capture the variance in brain responses across subjects and modalities on which basis a decomposition to independent components can be computed. The resulting components represent spatial (fMRI) and temporal (EEG) characteristics of brain responses. Here, the lower row shows the averaged ERP (blue) and time courses of two components (red) alongside their associated spatial maps.