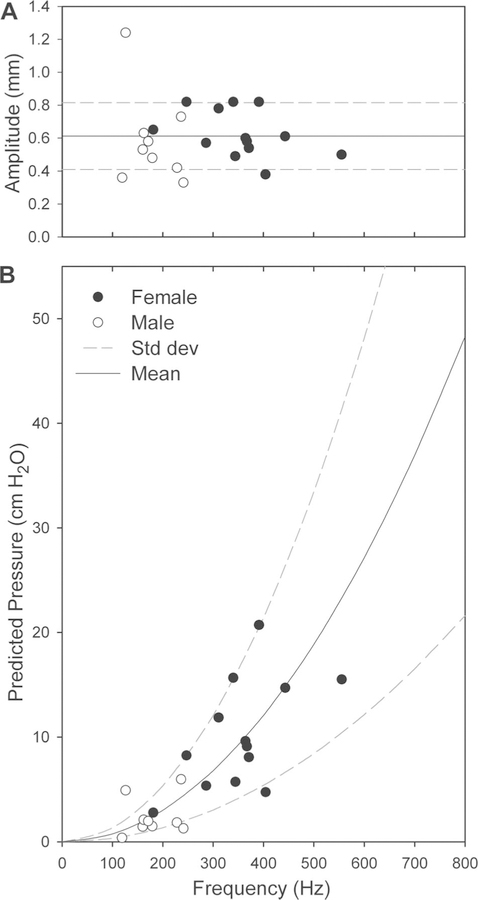
Fig. 3.
(A) Laser calibrated amplitude and frequency measurements of 13 female and 9 male volunteers with no signs, symptoms, or history of voice disorders, taken from a study by Schuster et al.20 (B) Estimated peak pressure values with respect to frequency when the measurements from (A) are plugged into equation three with sin2= 1. The fluid density of capillary blood was used for ρ, 1040 kg/m3. The mean and standard deviation of the amplitudes in (A) were used to plot the mean and standard deviation of the estimated peak pressure values in (B).

