
Figure 3.
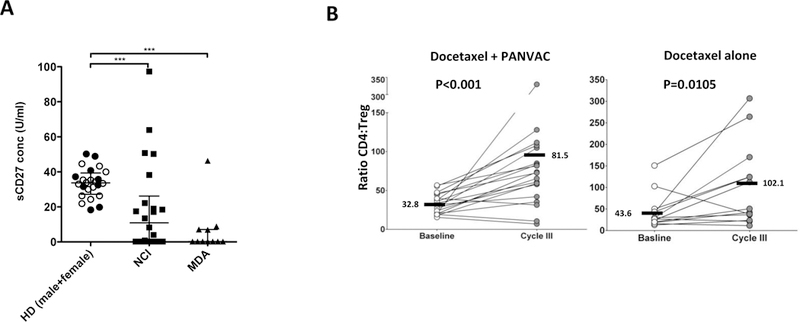
Immune changes pre- and post-therapy. A, Comparison of serum levels of soluble CD27 (sCD27) in healthy donors (female = black dots, male = white dots) vs. pre-treatment samples from enrolled patients, divided by the 2 centers. Dot plots show medians and interquartile range. ***p<0.001. B, Analysis of the changes in the ratio between CD4+ T lymphocytes and regulatory T cells (Tregs) at baseline vs. cycle 3 of docetaxel (28-day cycles, first restaging). Bars represent mean. P values calculated by Wilcoxon signed rank test.