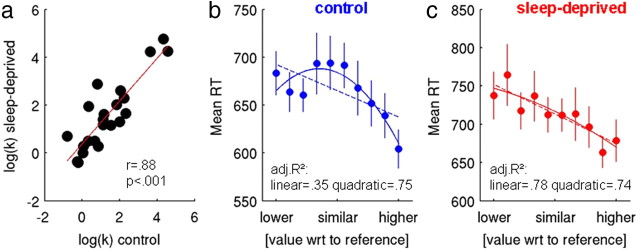
Figure 2.
a, Participants' log-transformed probability discount rates showed highly significant test–retest reliability. b, c, RTs were binned depending on the value difference between options. For CON (b), a quadratic function provided a significantly better fit to the RT data than a linear function, which was not the case for SD (c). Solid lines in b and c depict the best quadratic fit, and dashed lines depict the best linear fit. Error bars indicate SEM.

