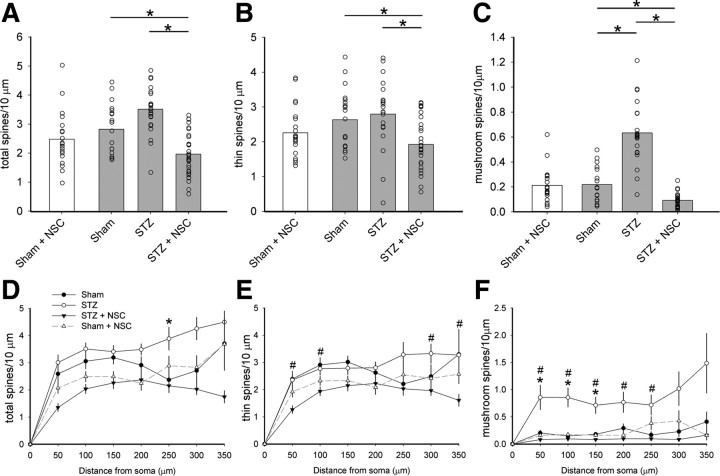
Figure 4.
Quantitative analysis of dendritic spine density and spatial distribution. Analyses of reconstructed neurons reveal differences in spine density (top row panels) and distribution (bottom row panels). A, B, Total spine density, which includes all spine shapes (A), and thin spine density (B) did not change in diabetic animals compared with Sham (one-way ANOVA with Bonferonni's post hoc, p > 0.05). C, Mushroom spine density, however, increased by more than threefold in STZ-induced diabetic animals compared with Sham (one-way ANOVA on ranks with Dunn's method, *p < 0.05). Treatment with NSC23766 significantly reduced spine density for total, thin-shaped, and mushroom-shaped spines compared with STZ (one-way ANOVA with Bonferonni's post hoc or one-way ANOVA on ranks with Dunn's method, *p < 0.05). Dendritic spine distribution for total (D), thin (E), and mushroom (F) spines demonstrate significant changes in STZ diabetic animals. Total (D) spine distribution assessment shows significant redistribution in STZ diabetic animals compared with Sham (one-way ANOVA on ranks with Dunn's method, *p < 0.01; at 250 μm: 2.37 ± 0.93 vs 3.89 ± 1.78 spines/10 μm dendrite). Similarly, for mushroom spines (F), significantly more spines were located more proximal to the soma in the STZ group compared with Sham (one-way ANOVA on ranks with Dunn's method, *p < 0.05; at 50 μm: 0.20 ± 0.22 vs 0.86 ± 1.07 spines/10 μm dendrite; at 100 μm: 0.15 ± 0.12 vs 0.86 ± 0.82 spines/10 μm dendrite; at 150 μm: 0.18 ± 0.17 vs 0.71 ± 0.71 spines/10 μm dendrite). NSC23766 treatment of STZ animals resulted in decreased thin spine (E) densities at multiple regions compared with untreated STZ animals (one-way ANOVA on ranks with Dunn's method, #p < 0.05; at 50 μm: 1.26 ± 0.82 vs 2.35 ± 1.34 spines/10 μm dendrite; at 100 μm: 1.93 ± 0.91 vs 2.77 ± 1.11 spines/10 μm dendrite; at 300 μm: 1.96 ± 0.91 vs 3.32 ± 1.41 spines/10 μm dendrite; at 350 μm: 1.60 ± 1.0 vs 3.27 ± 1.17 spines/10 μm dendrite). NSC23766 treatment in STZ animals restored mushroom spine (F) distribution back to Sham levels by decreasing dendritic spine densities compared with untreated STZ animals (one-way ANOVA on ranks with Dunn's method, #p < 0.05; at 50 μm: 0.08 ± 0.13 vs 0.86 ± 1.07 spines/10 μm dendrite; at 100 μm: 0.09 ± 0.08 vs 0.86 ± 0.82 spines/10 μm dendrite; at 150 μm: 0.08 ± 0.10 vs 0.71 ± 0.71 spines/10 μm dendrite; at 200 μm: 0.10 ± 0.10 vs 0.77 ± 0.85 spines/10 μm dendrite; at 250: 0.10 ± 0.11 vs 0.72 ± 0.78 spines/10 μm dendrite). Treatment with NSC23766 in nondiabetic Sham animals (A–C, white bars; D–F, dashed line) had no significant effect compared with untreated Sham. For spine density graphs, the open circles show individual animal means (for Sham plus NSC, n = 21; Sham, n = 20; STZ, n = 23; STZ plus NSC, n = 31). Distribution graphs are mean ± SEM.

