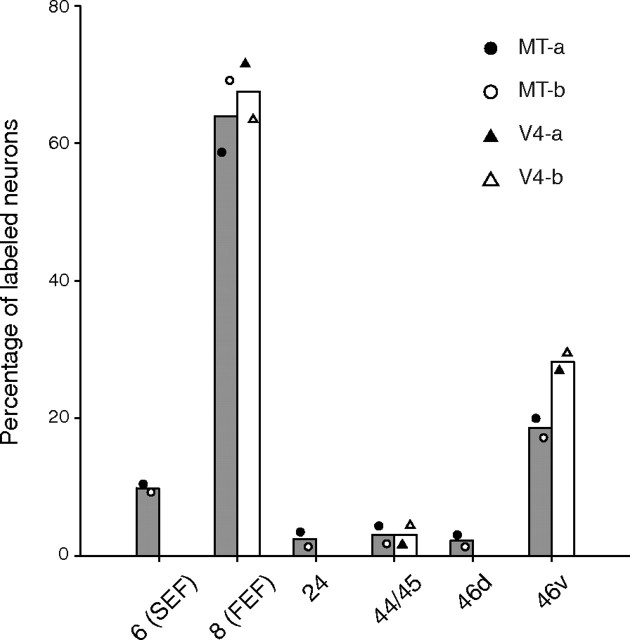
Figure 3.
Summary histogram showing the distribution of neuronal labeling in the frontal cortex 3 d after the rabies injections into MT and V4. The percentage of labeled neurons in each injection case is specified by symbols indicated on the upper right of each panel. The diagrams in this figure include data only when the percentage of labeled neurons in each area exceeds 3%. Each bar represents the averaged values of the MT (gray)- or V4 (white)-injection cases.

