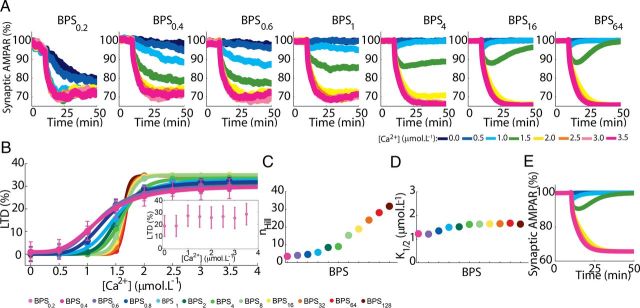
Figure 9.
Dependence of the macroscopic LTD responses on BPS. A, Macroscopic curves of LTD (means of 156 runs, Ca2+ pulses of 4 s applied at 10 min) showing the reduction in the variability and stability of responses when BPS is altered. Lowering BPS leads to a monostable system with spontaneous LTD while increasing it leads to a bistable system, similar to deterministic versions of the model (E). Stable intermediary mean levels of LTD, similar to those observed experimentally, are present only between BPS0.6 to BPS4. B, Sigmoidal relationship between the macroscopic LTD and peak [Ca2+] (pulses of 4 s) obtained using different BPSs. Data from 156 runs are plotted as mean ± SEM. Inset shows the responses of BPS0.2 that could not be fitted with a sigmoid. C, D, nHill and K1/2 for different BPSs. E, The same model was solved deterministically (using the Runge–Kutta method). In the absence of stochasticity the model shows a bistable behavior (see A for legend).

