
Figure 1.
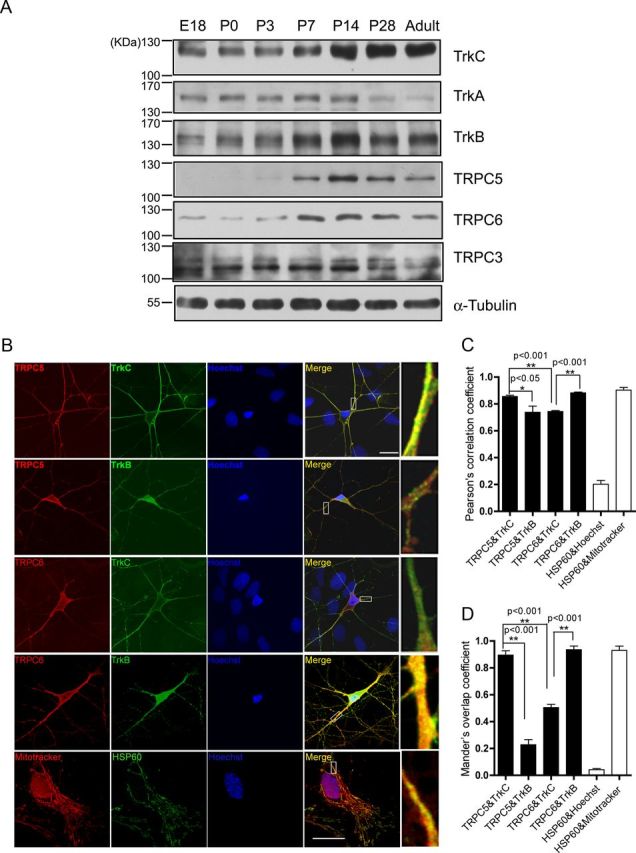
The expression of Trks and TRPCs in rat hippocampus. A, Western blots of total lysates extracted from rat hippocampus at different developmental stages with indicated antibodies. α-Tubulin served as a loading control. B, Representative staining of cultured hippocampal neurons at 7 DIV with the indicated antibodies or dyes. Right, Ninefold magnification of the white rectangle areas in “Merge.” Bottom, Representative staining of culture astrocytes at 7 DIV labeled with Mitotracker anti-HSP60 for mitochondria and Hoechst33342 for nucleus. Scale bar: 20 μm. C, D, Quantification of the colocalization of TRPCs and Trks shown in B. Lower limit: HSP60 and Hoechst33342, PCC, 0.202 ± 0.028; MOC, 0.042 ± 0.008. Upper limit: HSP60 and Mitotracker, PCC, 0.903 ± 0.020; MOC, 0.931 ± 0.032. In each group, 4–11 pictures were analyzed, *p < 0.05; **p < 0.01.