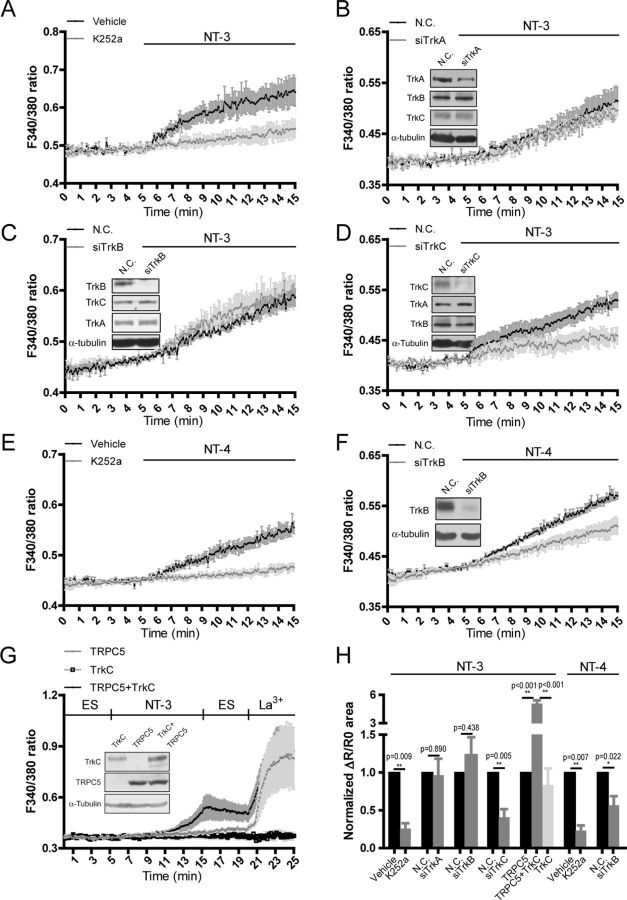
Figure 4.
TrkC mediated the activation of TRPC5 by NT-3. Fura-2 AM imaging showed [Ca2+]i changes in the neurons. A–D, Effect of NT-3 on [Ca2+]i elevation in the presence or absence of 200 nm K252a (A) or in the neurons transfected with N.C. or siTrkA (B), siTrkB (C), or siTrkC (D). E, F, Effect of NT-4 on [Ca2+]i elevation in the presence or absence of 200 nm K252a (E) or in the neurons transfected with N.C. siRNA or siTrkB (F). Insets, representative immunoblots showing the specific knockdown of endogenous TrkA (B), TrkB (C, F) or TrkC (D) in the neurons. Cultured hippocampal neurons were electroporated with indicated siRNA and imaged at 7–9 DIV. G, Effect of NT-3 or LaCl3 on [Ca2+]i elevation in HEK293 cells expressing TRPC5 and TrkC either individually or in combination. Upper line, Time scale with indicated stimulations. ES, extracellular solution. Inset, representative immunoblots showing the expression of exogenous TrkC and TRPC5 in the cells. H, Statistics for A–G, *p < 0.05; **p < 0.01. Corresponding bar charts show the normalized area of ΔR/R0 curves within stimulation. Data were means ± SEM from at least three independent experiments with >40 cells in each group.

