Figure 5.
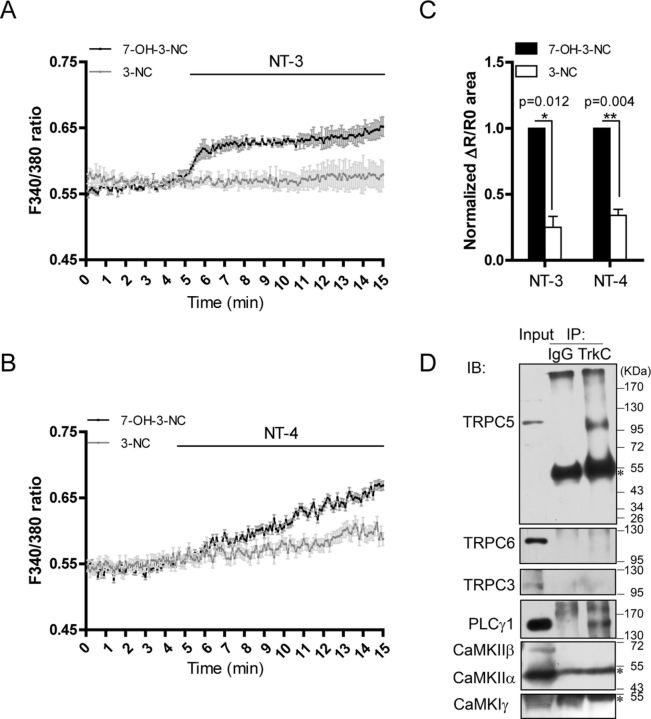
NT-3 activated TRPC5 through PLCγ. Fura-2 AM imaging showed [Ca2+]i changes in the neurons. A, C, NT-3-induced [Ca2+]i elevation in the presence of 30 μm 3-NC or the inactive analog 7-OH-3-NC. p = 0.012 vs 7-OH-3-NC. B, C, NT-4-induced [Ca2+]i elevation in the presence of 30 μm 3-NC or 7-OH-3-NC. p = 0.004 vs 7-OH-3-NC. C, Statistics of the normalized area of ΔR/R0 curves induced by indicated neurotrophins shown in A and B. Data were means ± SEM from at least three independent experiments with >60 cells in each group. D, Representative immunoblot shows that TrkC was immunoprecipitated (IP) with TRPC5 and PLCγ1, but not TRPC6, TRPC3, CaMKIIα, CaMKIIβ, and CaMKIγ. IgG served as a negative control. Asterisk indicates the IgG heavy chain.

