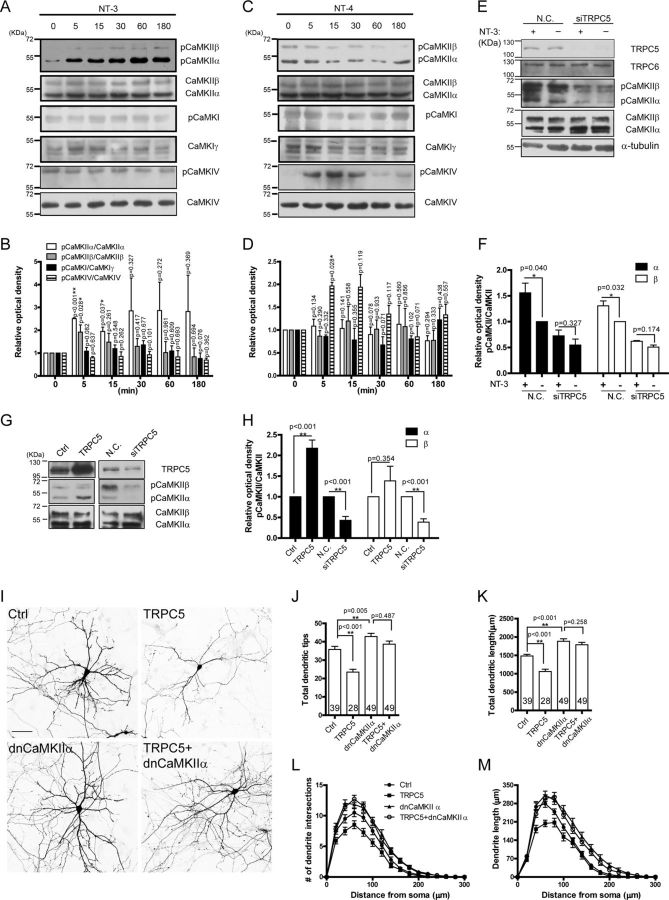
Figure 7.
NT-3 inhibited dendritic growth through TRPC5-CaMKIIα pathway. A, NT-3 enhanced the CaMKIIα or CaMKIIβ phosphorylation at Thr286 or Thr287, respectively, in a time-dependent manner. B, Statistics for A. C, NT-4 enhanced CaMKIV phosphorylation at Thr196. D, Statistics for C. Cell lysates were extracted from cultured hippocampal neurons at 7 DIV. E, Knocking down TRPC5 abolished NT-3-induced CaMKII activation. Cell lysates extracted from the neurons electroporated with siTRPC5 and treated with NT-3 for 15 min were Western-blotted with indicated antibodies. F, Statistics for E. G, TRPC5 was necessary and sufficient to activate CaMKIIα. Immunoblots showed that increasing TRPC5 expression raised the CaMKIIα phosphorylation level in the neurons and that, conversely, decreasing TRPC5 expression lowered both the CaMKIIα and the CaMKIIβ phosphorylation levels in the neurons. Cell lysates were extracted from the neurons electroporated with TRPC5 or siTRPC5 at 4 DIV. H, Statistics for G. α-Tubulin served as a loading control. I, Representative images for the neurons transfected with TRPC5 or the dnCaMKIIα individually or in combination at 4–5 DIV and observed at 9–10 DIV. Scale bar: 50 μm. J, Quantification of total dendritic tips of the neurons shown in I. Control (Crtl), 35.80 ± 1.67; TRPC5, 23.48 ± 1.54; dnCaMKIIα, 42.87 ± 1.70; TRPC5 plus dnCaMKIIα, 38.70 ± 1.69. K, Quantification of total dendritic length of the neurons shown in I. In μm, control (Ctrl), 1481.71 ± 46.05; TRPC5, 1058.63 ± 62.71; dnCaMKIIα, 1882.03 ± 69.00; TRPC5 plus dnCaMKIIα, 1788.68 ± 45.06. L, M, Sholl analyses of the neurons shown in I. The numbers of neurons analyzed shown within the bar. Data were means ± SEM from at least three independent experiments. *p < 0.05; **p < 0.01.

