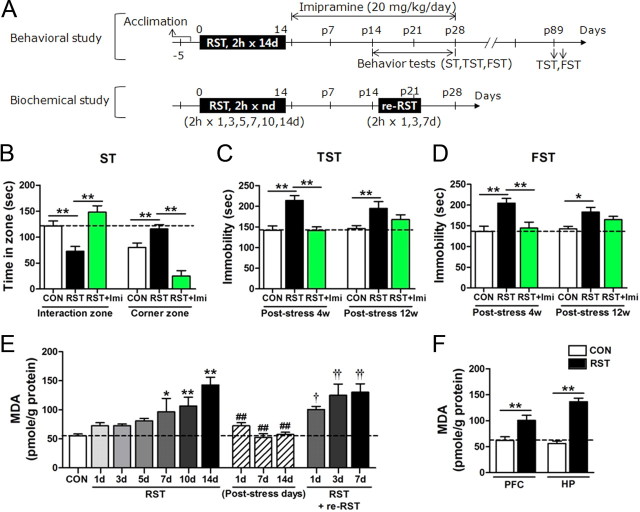
Figure 1.
Repeated stress promoted lasting behavioral changes and increased oxidative stress in the brain. A, Experimental design for treatment with 2 h × 14 d restraint and behavioral/biochemical assessments. Restress was given with 2 h-restraint for indicated days. RST, restraint. B, Behavioral performance in the social interaction test. Time spent in the interaction zone and corner zones (n = 9–11 animals). One-way ANOVA and Newman–Keuls post hoc test [F(2,27) = 13.70, p < 0.0001 for the interaction zone; F(2,27) = 25.51, p < 0.0001 for the corner zone]. RST, mice treated with 2 h × 14 d restraint; RST+Imi, mice treated with RST and imipramine. ST, sociability test; CON, control. C, D, Immobility time in the tail suspension test (C) and forced swim test (D) on poststress days 28–29 (poststress 4w) and poststress days 89–90 (poststress 12w) (n = 8 animals for each group, each time). Two-way repeated-measures ANOVA and Bonferroni post hoc test; significant difference among groups in TST [F(2,21) = 13.94, p = 0.0001] and FST [F(2,21) = 12.35, p < 0.001], and no interaction between restraint or imipramine with time [F(2,21) = 2.373, p = 0.1177 in TST; F(2,21) = 2.005, p = 0.1597 in FST]. E, MDA levels in the hippocampus after treatment with restraint for indicated days (control, n = 12; RST group, n = 6–9; poststress group, n = 8; re-RST group, n = 8). One-way ANOVA and Newman–Keuls post hoc test [F(6,49) = 9.220, p < 0.0001 for RST groups; F(3,26) = 29.78, p < 0.0001 for groups marked with the poststress period; and F(3,28) = 7.128, p < 0.01 for re-RST groups]. F, MDA levels in the hippocampus and prefrontal cortex after treatment with the 2 h × 14 d restraint (n = 6–8). Two-way ANOVA and Bonferroni post hoc test; significant effect of RST [F(1,22) = 65.13, p < 0.0001], no significant effect of different brain regions [F(1,22) = 4.206, p = 0.0524], and significant interaction between RST and brain-region [F(1,22) = 7.989, p < 0.01]. One-way ANOVA and Newman–Keuls post hoc test; significant difference in stress effects between hippocampus and prefrontal cortex [F(3,22) = 28.19, p < 0.0001]. Data are presented as the means ± SEM. * and **, differences between the indicated groups or from the control; # and ##, differences from the fourteenth RST group; † and ††, difference from the poststress day 14 group, at p < 0.05 and p < 0.01, respectively.

