Figure 2.
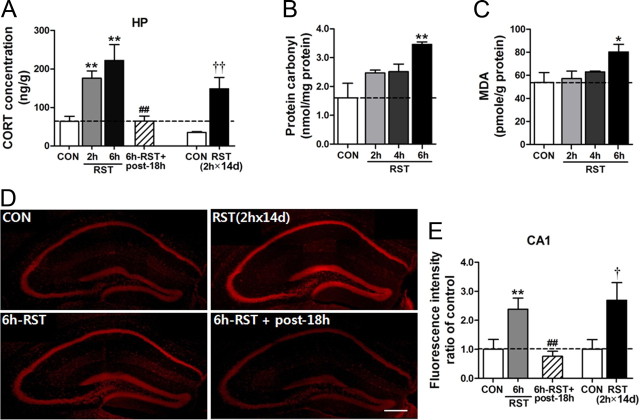
Stress increased GC and ROS levels in the brain. A, Stress-dependent increase of GC in the brain tissue. GC levels were measured from the hippocampus immediately after treatment with a single dose of 2 h or 6 h restraint and at 18 h after 6 h restraint. GC levels were also measured from the hippocampus immediately after 2 h × 14 d restraint. Brains were prepared from mice perfused with 0.9% saline to minimize blood contribution (n = 8). One-way ANOVA and Newman–Keuls post hoc test for 2 h or 6 h restraint groups [F(3,28) = 10.69, p < 0.0001]. Student's t test for 2 h × 14 d restraint groups. B, C, Stress-dependent increase of lipid peroxidation and protein carbonylation levels. Restraint was treated for 2, 4, or 6 h (n = 6 for each group). One-way ANOVA and Newman–Keuls post hoc test [F(3,20) = 3.465, p < 0.05 for lipid peroxidation levels; F(3,20) = 6.830, p < 0.01 for protein carbonylation levels]. D, E, DHE-reactive ROS levels in the hippocampus after 2 h × 14 d restraint [RST(2 h × 14 d)], 6 h restraint (6 h-RST), and at 18 h after 6 h restraint (6 h-RST+post-18 h) (D). ROS levels in the CA1 region visualized by staining of brain sections with DHE were quantified (E) (n = 7–8). One-way ANOVA and Newman–Keuls post hoc test [F(2,21) = 7.811, p < 0.01 for 2 h, 4 h, 6 h × 1 d and 18 h after 6 h × 1 d restraint groups]. Student's t test for 2 h × 14 d restraint groups. Scale bar, 200 μm. Data are presented as the means ± SEM. * and **, differences from the control; # and ##, differences from the 6 h × 1 d RST group; † and ††, differences from the control of the RST(2 h × 14 d) group, at p < 0.05 and p < 0.01, respectively.

