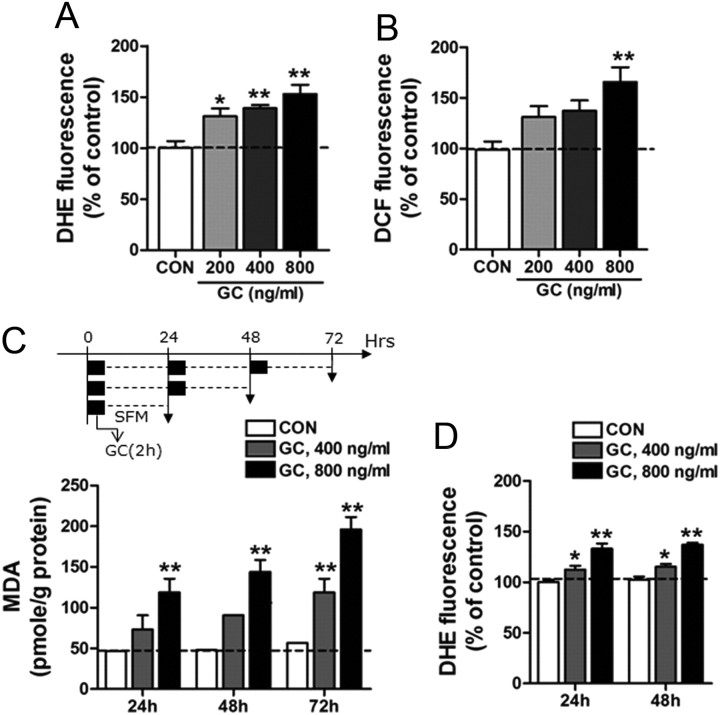
Figure 3.
GC treatment increased superoxide and ROS levels in cultured neuronal cell lines. A, B, Treatment of HT22 cells with GC accumulated superoxide (A) and dichlorofluorescein (DCF)-reactive ROS levels (B). HT22 cells were treated with GC at indicated doses for 24 h. Superoxide and ROS levels were measured by staining with DHE and DCF, respectively. CON, control cells; GC, cells treated with GC. One-way ANOVA and Newman–Keuls post hoc test; significant effects of GC on superoxide levels [F(3,12) = 10.03, p < 0.01] and ROS levels [F(3,27) = 5.637, p < 0.01]. C, MDA levels after treatment with GC in SH-SY5Y cells. Cells were treated with GC (400 or 800 ng/ml) for 2 h (black box) and, after washing, were cultured in serum-free medium (SFM) for 22 h (broken line). This procedure was repeated for 1–3 d. Data were expressed as the percentage of the 24 h control. Two-way ANOVA and Bonferroni post hoc test; significant effect of GC doses [F(2,45) = 54.51, p < 0.0001] and time [F(2,45) = 10.49, p < 0.001], and no interaction between GC dose and time [F(4,45) = 1.993, p = 0.1118]. D, Treatment with GC in SH-SY5Y cells generated superoxide. Cells treated with GC (400 or 800 ng/ml) for 2 h daily for 24 or 48 h. Superoxide levels were measured by staining with DHE. Two-way ANOVA and Bonferroni post hoc test; significant effect of GC doses [F(2,30) = 52.88, p < 0.0001], no effect of time [F(1,30) = 1.365, p = 0.2519], and no interaction between GC dose and time [F(2,30) = 0.02626, p = 0.9741]. Data are presented as the means ± SEM (n = 4–8). * and **, differences from the control at p < 0.05 and p < 0.01, respectively.

