Figure 4.
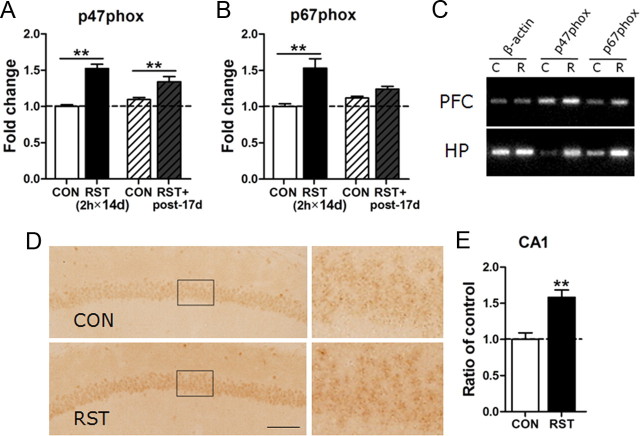
Repeated stress increased the expression of p47phox and p67phox in the brain. A, B, Real-time PCR data showing stress-induced upregulation of p47phox (A) and p67phox (B) in the hippocampus at the end of 2 h × 14 d stress (2 h × 14 d) and on poststress day 17 (post-17 d) (n = 6). Two-way ANOVA and Bonferroni post hoc test; for p47phox, the main effect of restraint (RST) was significant [F(1,20) = 60.57, p < 0.0001]. The RST effect was sustained until poststress day 17 [F(1,20) = 0.8225, p = 0.3753], but the increased expression of p47phox by RST was reduced over time [RST×poststress days: F(1,20) = 7.922, p < 0.05]. For p67phox, the effect of RST was significant [F(1,20) = 20.61, p < 0.001]. The RST effect was sustained until poststress day 17 [F(1,20) = 1.417, p = 0.2479], but the increased expression of p67phox by RST was reduced over time [RST×poststress days: F(1,20) = 8.021, p < 0.05]. C, Representative RT-PCR data showing the expression of p47phox and p67phox in the prefrontal cortex (PFC) and hippocampus (HP) of the control mice (C) and mice treated with the 2 h × 14 d restraint (R). Each PCR was prepared from five animals. D, E, Photomicrographs showing the expression of p47phox in the CA1 pyramidal cell layers of the hippocampus of the nonstress control (CON) and mice treated with the 2 h × 14 d restraint (RST). High magnifications of pyramidal cell layers marked with a rectangle are shown. Immunoreactivity for p47phox in the hippocampus was detected mostly in neuronal cells (n = 7–8). Scale bar, 100 μm. Student's t test (p < 0.01). Data are presented as the means ± SEM (n = 6–8). * and **, differences from the control at p < 0.05 and p < 0.01, respectively.

