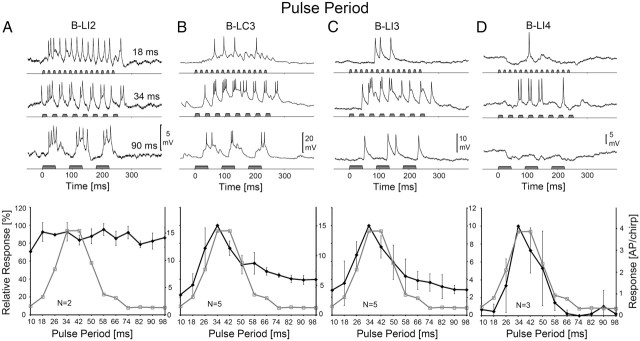
Figure 5.
Activity of B-LI2, B-LC3, B-LI3, and B-LI4 and phonotactic tuning of females to different PP. Top, Response of neurons at PP-18, 34, and 90 ms. Bottom, Phonotactic (gray) and neural (black) PD-response functions. A, Activity and response function of B-LI2. Neural data are based on N = 2 females and n = 13 test sequences, 2 stainings. B, Activity and response function of B-LC3. Neural data are based on N = 5 females and n = 23 test sequences, 4 stainings. C, Activity and response function of B-LI3. Neural data are based on N = 5 females and n = 18 test sequences, 4 stainings. D, Activity and response function of B-LI4. Neural data are based on N = 3 females and n = 10 test sequences, 2 stainings. The left scale indicates relative neural and phonotactic activity, and the right scale shows the absolute values of spike activity. Error bars show SD of relative values.

