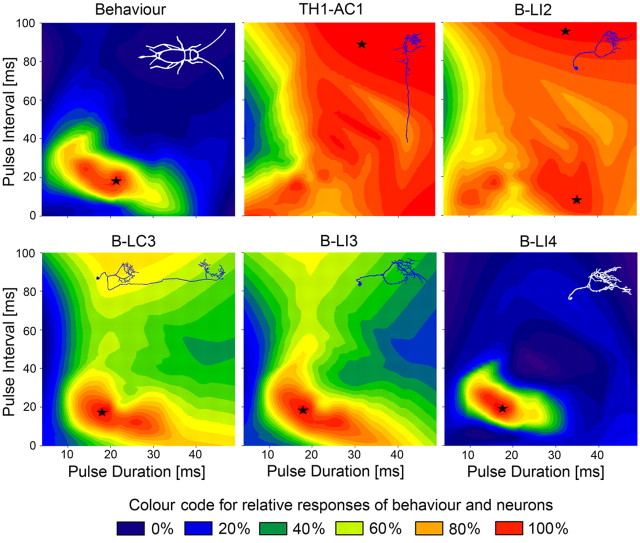
Figure 6.
Relative responses of phonotaxis and brain neurons plotted against pulse duration (abscissa) and pulse interval (ordinate) based on all data points of the PD, PI, and PP test paradigms (e.g., data along the diagonal from the bottom left to the top right represent responses to the PP paradigm). In each plot, the x-axis starts at a pulse duration of 4 ms. Responses are color coded with red showing the area of maximum response, indicated by asterisks.

