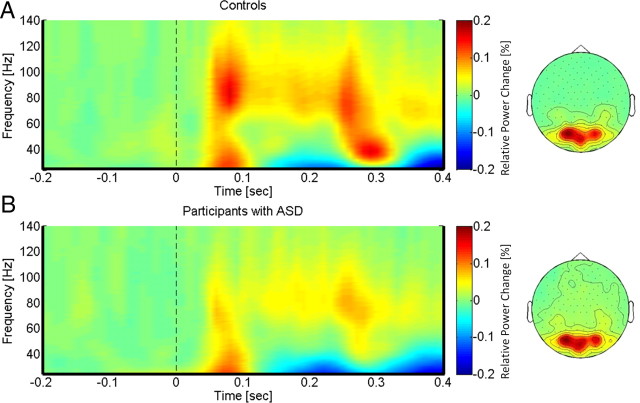
Figure 4.
TFRs and topographies of gamma-band spectral power in the face condition for controls (A) and participants with ASD (B). The gamma-band signal is expressed as relative power change in the poststimulus time window compared to baseline, averaged across all channels and all subjects in each group. The topographies are averaged across the poststimulus interval (0–400 ms) and between 25 and 120 Hz.

