
Figure 5.
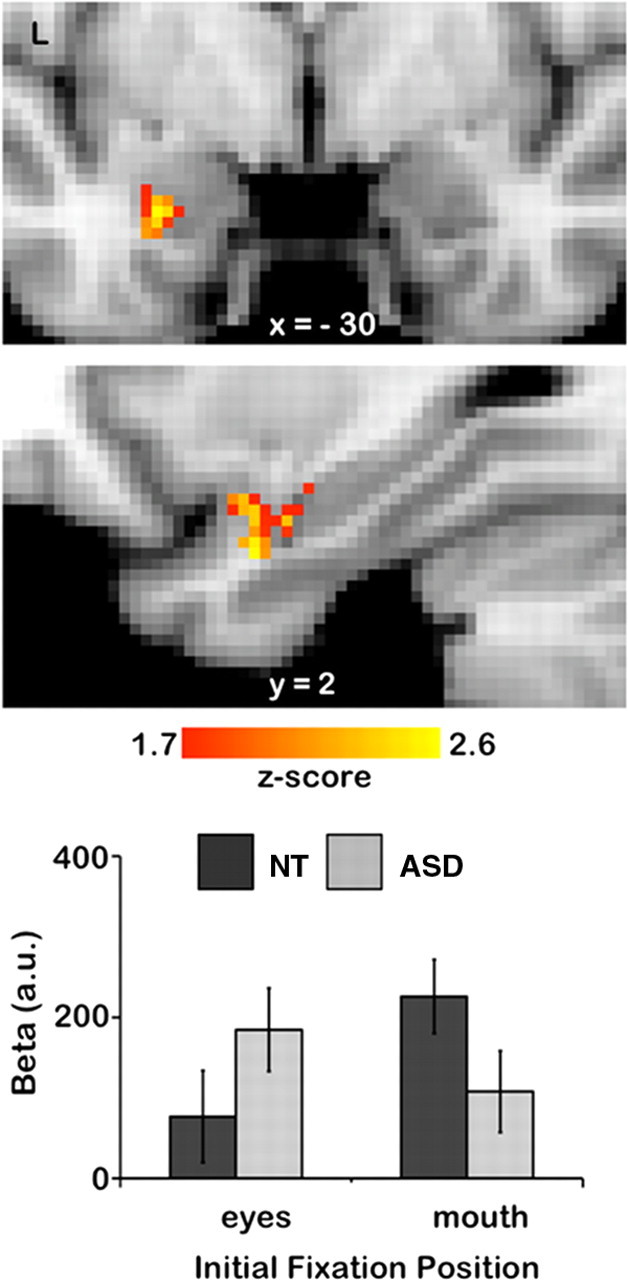
Amygdala region showing a significant interaction of Initial Fixation position and Group. The upper two panels show statistical maps of coronal and left (L) sagittal planes. The lower bar shows the extracted β values of the cluster reported in Table 2 (p = 0.05, FWE corrected). Error bars represent SE.