Figure 1.
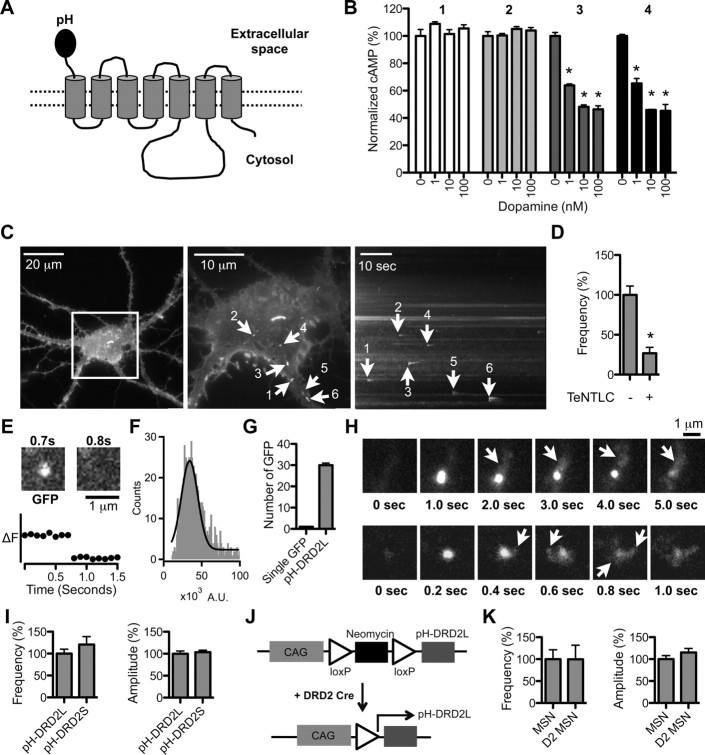
Visualization of pH-DRD2 insertion in cultured MSNs. A, Schematic drawing of the pH-DRD2 construct. B, cAMP accumulation assay to determine DRD2 function in HEK 293 cells: untransfected cells (1), vector-transfected cells (2), DRD2 (nontagged) transfected cells (3), and pH-DRD2 transfected cells (4). Activation of DRD2 inhibits cAMP accumulation. Untransfected and vector-transfected cells do not respond to DA stimulation, while DRD2 (nontagged) and pH-DRD2 display similar sensitivities to DA at three different concentrations: 1, 10, and 100 nm. C, Left, pH-DRD2L in a cultured MSN visualized under epifluorescent mode using a 40×, 1.30 NA objective. The white square in the middle represents the field of view under TIRF imaging mode using a 100×, 1.46 NA objective, as seen in the middle. Middle, Maximum-intensity projection image of pH-DRD2L fluorescence of the same cultured MSN visualized under TIRF imaging mode; white spots with arrowheads represent individual pH-DRD2L insertion events as visualized under TIRFM. Right, y–t maximum-intensity projection image of pH-DRD2L fluorescence in the same cultured MSN visualized under TIRF imaging mode; arrowheads indicate individual pH-DRD2 insertion events as indicated in the middle panel. D, Quantification of pH-DRD2L insertion frequency with or without TeNTLC. E, The two images show a single GFP fluorescent spot before (left) and after (right) the single-step photobleaching; the plot underneath the images shows fluorescence changes over time at this fluorescent spot. Single-step photobleaching occurs between 0.7 and 0.8 s. F, Fitting the primary peak of single GFP fluorescence intensity to a Gaussian function results in a Gaussian profile with the center of the Gaussian function representing a single GFP fluorescence level. G, By normalizing the average total fluorescence level of pH-DRD2 to single GFP fluorescence, the number of pH-DRD2L molecules in individual insertion events can be derived. H, Two representative insertion events of pH-DRD2 followed by lateral diffusion. The arrows indicate diffusion of pH-DRD2L from the initial insertion site. I, Comparison of pH-DRD2L and pH-DRD2S in MSNs. J, Experimental design for examination of pH-DRD2L insertion properties in D2-type MSNs. In pCALNL-pH-DRD2L, the translation of pH-DRD2L is prevented by a floxed neomycin cassette. Transfecting this pCALNL-pH-DRD2L construct into MSNs cultured from DRD2 Cre embryos will result in specific expression of pH-DRD2L in D2-type MSNs. K, Comparison of pH-DRD2L insertion between MSNs and D2-type MSNs. MSN, pH-DRD2L insertion without discrimination of D1-type versus D2-type MSNs, using pRK5-pH-DRD2L construct; D2 MSN, pH-DRD2L insertion in D2-type MSNs using pCALNL-pH-DRD2L construct. Asterisks denote statistical significance compared to the control group.

