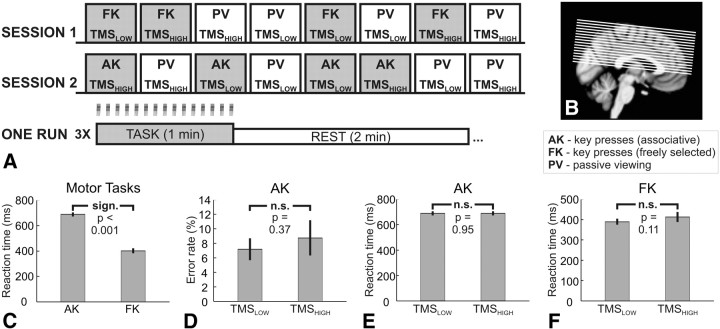
Figure 1.
A, Schematic diagram of the experimental design. One motor task was tested per session (either AKs or FKs), whereas PV was assessed in both sessions. One condition was investigated per experimental run. The order of runs within one session was pseudorandomized across subjects, and the order of sessions was counterbalanced across subjects. Each run consisted of three alternating epochs of task and rest, with task epochs lasting 60 s and rest epochs lasting 120 s. B, Brain coverage of the CASL sequence. The field of view contained most of the cortical motor network. C, RTs for the two different tasks, averaged across TMS intensities. D, Error rates for the associative task in dependence on TMS intensity. E, Dependence of RTs during the associative task on TMS intensity. F, RTs during the free selection task in dependence on TMS intensity. In C–F, the error bars represent the SE across subjects.

