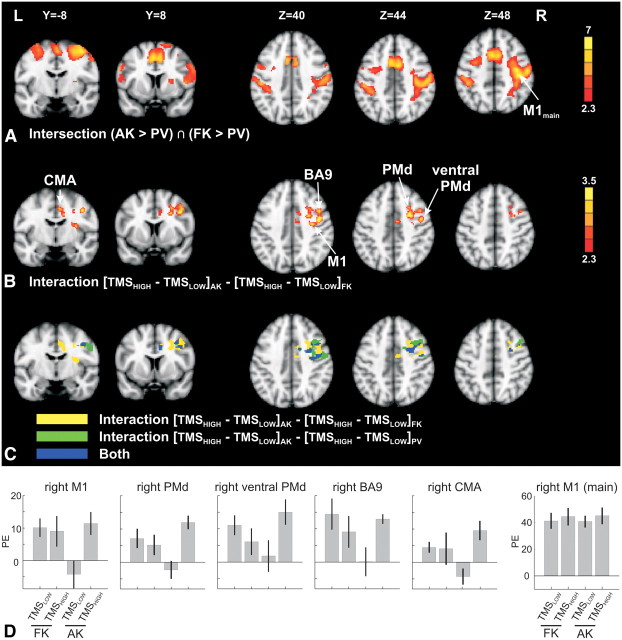
Figure 2.
Group rCBF activation maps (MNI space); unless indicated otherwise, a threshold of Z = 2.3 (corresponding to p = 0.01) at the voxel level and a cluster probability threshold of p = 0.05 were used for all figures. A, Regions more strongly activated during both tasks compared with PV. Color coded are the Z-values of the comparison AK > PV after masking with the activations for FK > PV. B, Interaction between motor task and TMS intensity [(TMSHIGH − TMSLOW)AK − (TMSHIGH − TMSLOW)FK]. C, Overlap of the results depicted in B with the interaction between AKs versus PV and TMS intensity [(TMSHIGH − TMSLOW)AK − (TMSHIGH − TMSLOW)PV]. D, To visualize the rCBF changes across conditions, PEs (proportional to the rCBF changes) are shown for six ROIs as indicted by the arrows in A and B. The error bars represent the SE across subjects.

