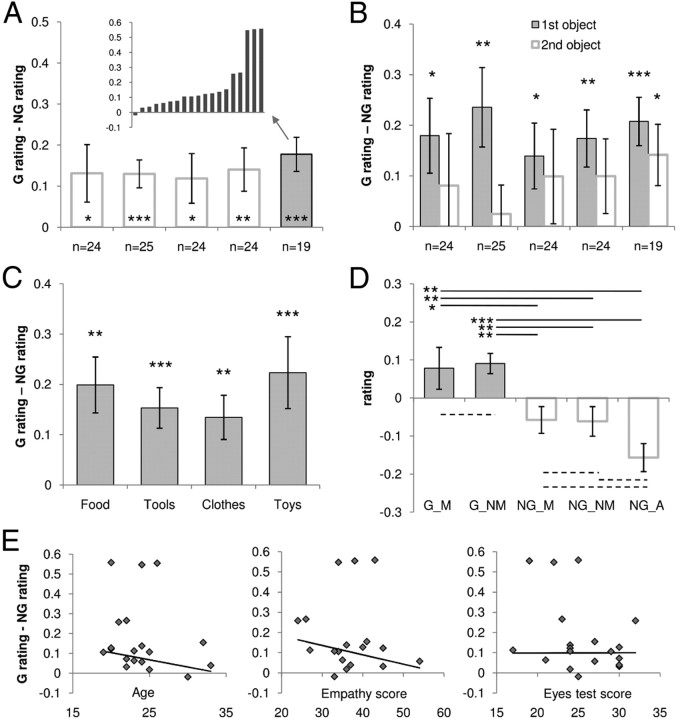
Figure 2.
The MDE. Histograms illustrate the MDE, defined as the difference in Z-scored desirability ratings between G and NG objects. Error bars indicate intersubject SEM. *p < 0.05, **p < 0.01, ***p < 0.001; paired t test. A, Overall MDE obtained in the five groups of participants. Group 5 (filled bar) corresponds to the subjects who were scanned using fMRI while performing the task. MDE of individual subjects in this group are shown above the bars. B, MDE calculated separately for the two objects of a pair. Filled and empty bars indicate objects that were presented during the first and second parts of an experimental session, respectively. C, MDE obtained in Group 5 for the different types of objects presented in the videos. D, MDE obtained in Group 5 for the different categories of videos. G videos (filled bars on the left) contained objects that were moved (G_M) or not (G_NM). NG videos (empty bars on the right) contained a human agent (NG_A) or not, with the object moved (NG_M) or not (NG_NM). As indicated with asterisks, all comparisons between G and NG categories were significant (solid lines), whereas no significant difference was found between G or NG subcategories (dashed lines). E, Correlation between MDE and other variables (age, empathy, and eye test scores). The y-axis indicates the MDE (difference in Z-scored desirability rating between G and NG objects). Scatter plots show the MDE for all individuals. No correlation was significant (tested using robust regression).

