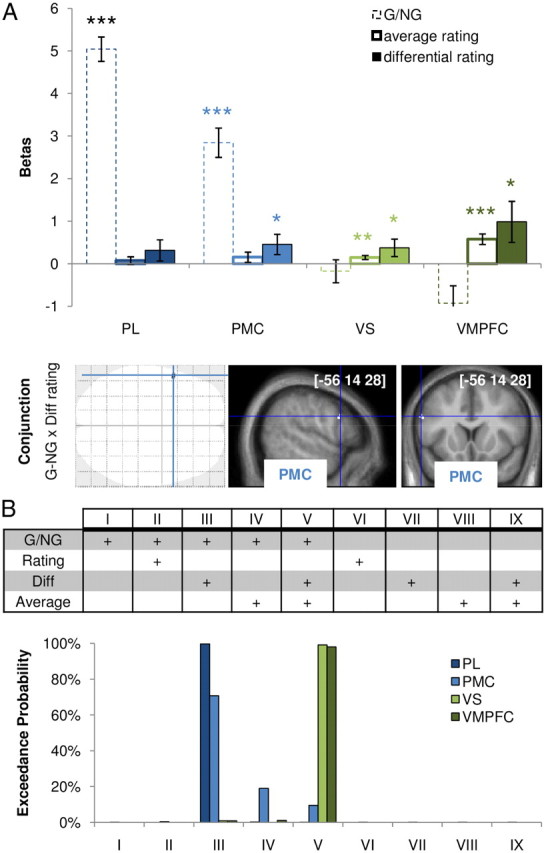
Figure 4.

Neural correlates of the MDE. A, Information encoded in the different ROIs. Regression coefficients were estimated using GLM2 parametric modulators. G/NG (dotted bars): binary variable that signaled objects being taken as goals. Average rating (empty bars): mean rating over current and paired objects. Differential rating (filled bars): difference between current object and average rating. Error bars indicate intersubject SEM. *p < 0.05, **p < 0.01, ***p < 0.001; one-sample t test. SPM was obtained from the conjunction between G/NG contrast and modulation by differential rating. Areas shown in black on glass brains and in white on slices showed significant group-level random effect (p < 0.001, one-sample t test; uncorrected, minimum of 10 voxels). Sagittal and coronal slices were taken at the global maximum of interest (in the premotor cortex). The [x, y, z] coordinates of the maximum refer to the Montreal Neurological Institute space. B, Comparison between GLM in the different ROIs. Bars indicate the probability of different models estimated using BMS. The model space explored in the BMS is illustrated in the table above the bars. Models could include or not include the G/NG contrast and could decompose or not decompose the desirability ratings into differential (Diff) and average ratings. +, Regressor included in the GLM.
