
Figure 8.
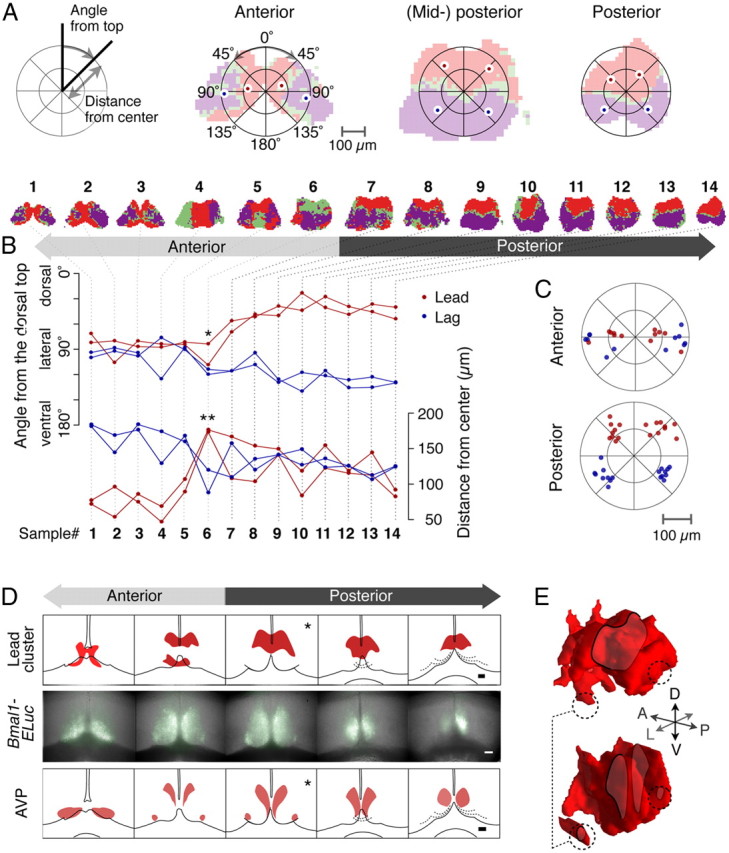
Characteristic cluster topographies summarized and compared with AVP immunostaining along the anterior–posterior axis. A, The cluster topography is quantitatively represented by the CM positions of the clusters on each unilateral side in polar coordinates. The origin is the CM of the whole SCN (left). Cluster CM positions in anterior, mid-posterior, and posterior SCNs are shown (right). B, Angular distribution of two major clusters along the AP axis shows an abrupt transition point (top, *). Radial distribution of the cluster CMs also reveals a strong transition (bottom, **). The top row shows shapes of clusters for 14 representative samples of 23 control recordings entrained under 12:12 LD. C, Cluster CM positions of all anterior (top) and posterior (bottom) samples. Two distinct patterns arise in the anterior and the posterior. D, The relative AP position of leading clusters (top row) can be estimated by the signature patterns of baseline Bmal1-ELuc expression (middle row). The patterns of Bmal1-ELuc are compared with the series of 30 μm thin sections, each 90 μm apart (bottom row), to identify their relative positions along the AP axis. Note the ventrolateral islands of AVP neurons are not included in the leading cluster (*). Scale bars, 100 μm. E, The leading clusters (top) and AVP immunostaining (bottom) along the AP axis are reconstructed in 3D (Fig. 7D) to reveal differences in spatial distributions (dashed circles).