
Figure 4.
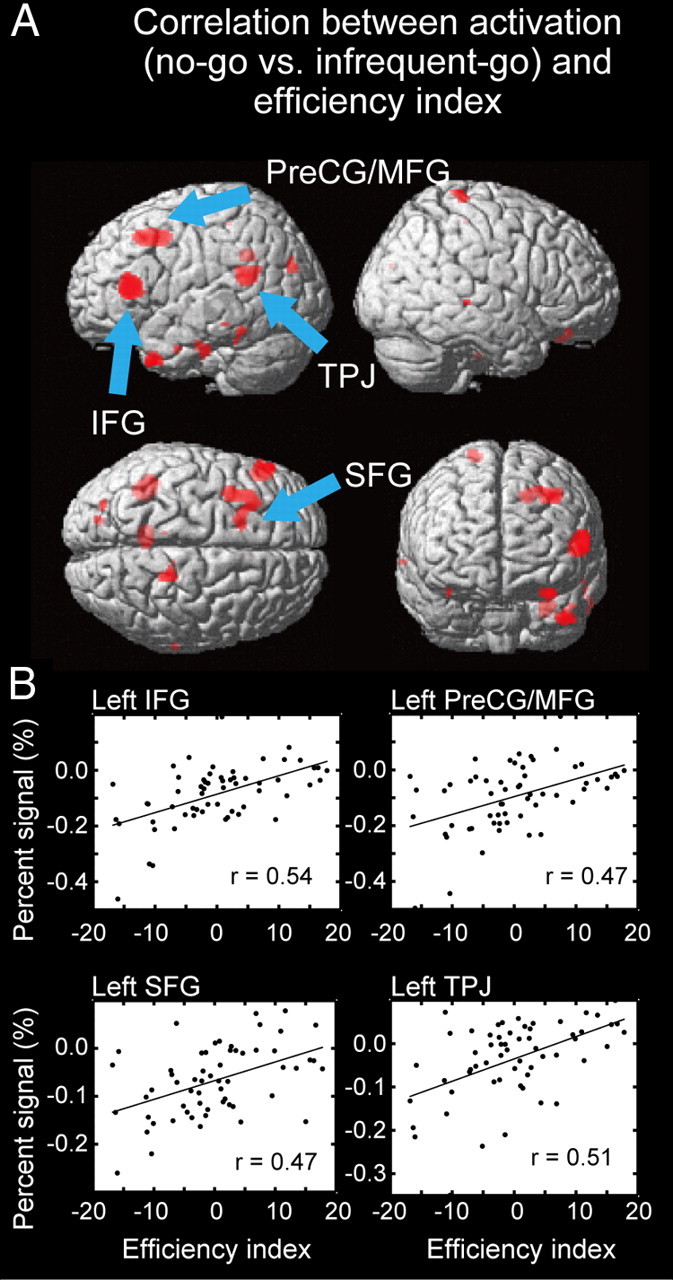
A, Statistical maps for correlation between the brain activation related to response inhibition and the efficiency index. Significant correlations were shown in red, overlaid on the surface of the three dimensional brain. B, The scatter diagram between the percentage signals related to response inhibition and the efficiency index in the regions detected as significant. One dot represents one subject. The black line in each panel indicates a regression line.