
Figure 5.
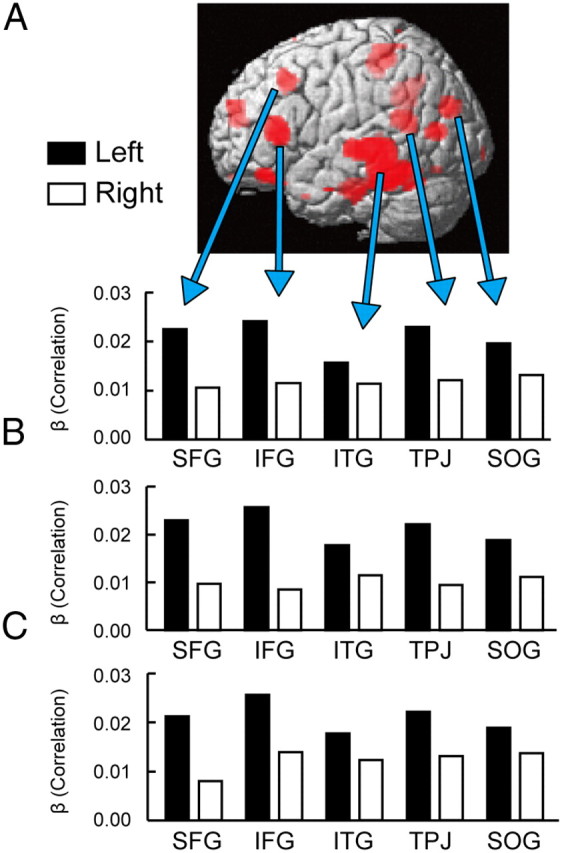
A, Five typical examples of regions showing hemispheric asymmetry in the magnitude of the correlations. Significant correlations after integrating bilateral correlations (see Materials and Methods, Data analysis) are shown in red on the surface of the three dimensional brain. ITG: inferior temporal gyrus, SOG: superior occipital gyrus. B, The magnitude of the correlation in the above five regions as calculated by determining contralateral regions of interest based on the largest resting-state functional connectivity peaks within a small sphere around mirrored peaks. C, The magnitude of the correlation in the five regions as calculated by determining contralateral regions of interest based on the largest correlation peak within a small sphere around mirrored peaks.