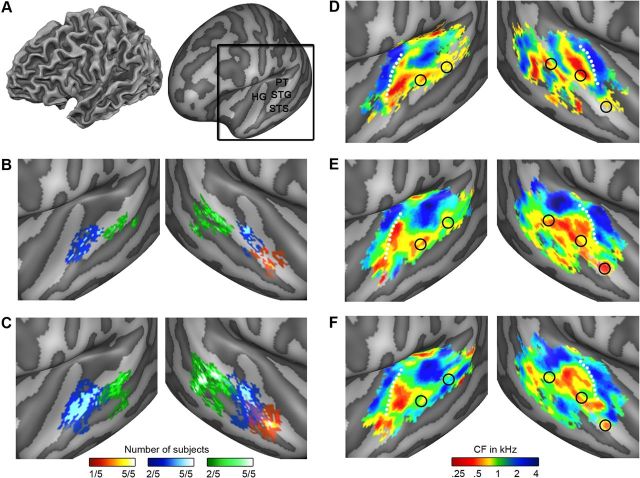
Figure 6.
Overlay between tonotopy and speech/voice regions. A, The black square outlines the cortical region shown in the remainder of this figure. The region includes HG, STG, STS, and PT. B, C, Speech/voice regions as defined by the natural sounds experiment and by the localizer, respectively. In both the natural sounds experiment and the localizer, we defined a middle (blue) and posterior (green) speech/voice cluster bilaterally. In the right hemisphere, we additionally identified an anterior cluster (red). For Talairach coordinates of speech/voice regions, see Table 1. D–F, Tonotopy group maps as extracted from the localizer (D) and the natural sounds (E, F) experiment (based on all sounds, and based on sounds with matched spectral content across categories, respectively). In D–F, peaks of speech/voice-sensitive regions are outlined in black on the tonotopy maps. See Figure 3 for all individual overlays and Table 1 and Figure 7 for the statistical assessment of the low-frequency bias in speech/voice regions.

