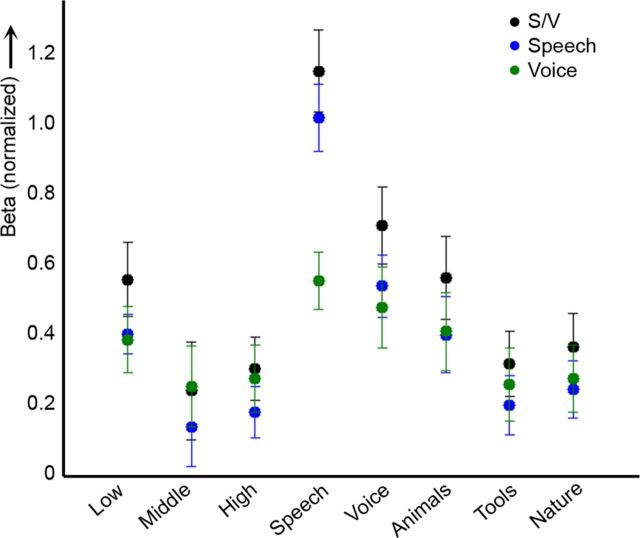
Figure 7.
Low-frequency bias in speech and voice regions. The normalized response (β values) of speech/voice regions (black), speech-sensitive regions (blue), and voice-sensitive regions (green; 300 most selective voxels as defined by the natural sounds experiment for each subject) to the tones and natural sounds in the localizer. Whiskers indicate the SE across subjects. Note that in all regions, responses are stronger to low (0.5 kHz) than to middle and high tones (1.5 and 2.5 kHz, respectively). For quantification of this effect in speech/voice regions, see Table 1.

