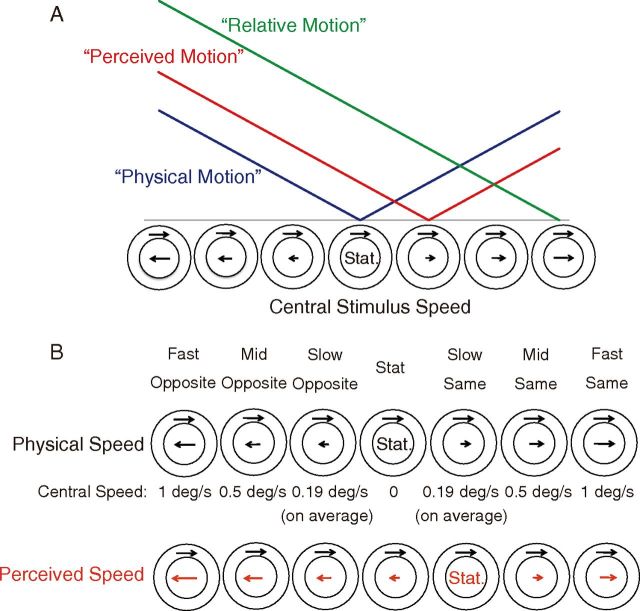
Figure 1.
A, Schematic illustration of the three hypotheses. Horizontal axis schematizes the speed and direction of the central stimulus (note that the speed of the surround stimulus is constant). Vertical axis depicts the hypothetical amplitude of neural activation. Each colored line indicates the predicted neural activation pattern when the activity is dependent on physical speed (blue), perceived speed modulated by induced motion (red), and the difference in speed between the center and surround (green). Note that the linearity of speed dependence is assumed here only for illustrative purposes but is not specifically tested; the critical point is the locations of the minimum activation, which the three hypotheses predict differently. B, Seven stimulus velocities. The velocity of the surrounding stimulus was identical across all conditions (1°/s). The central stimulus speed is shown in the row labeled Central Speed.

